BEIJING, July 17, 2017 /PRNewswire/ -- Zhaopin Limited (NYSE: ZPIN) ("Zhaopin" or the "Company"), a leading career platform[1] in China focused on connecting users with relevant job opportunities throughout their career lifecycle, released its 2017 second-quarter report on China labor market supply and demand for white-collar workers. As the competition for jobs eased in the second quarter, the average monthly salary dropped by 3.8% over the previous quarter, the first quarter-over-quarter decline in two years.
Second-Quarter of 2017 China White-Collar Labor Market Highlights:
Declining Salaries
Based on online job postings in 37 key cities in China compiled by Zhaopin, the average monthly salary in the second quarter of 2017 was RMB7,376, down 3.8% over the first quarter. This was the first time that the average monthly salary declined quarter-over-quarter since the second quarter of 2015 when Zhaopin began to calculate the nationwide average salary for white-collar workers.
The falling average salary for white-collar workers was mainly caused by the plunge in salaries at micro-sized companies, which cut their salaries by 31% in the second quarter. With investment waning, many small start-ups became more rational and could no longer offer higher salaries to attract talents. An additional factor contributing to the overall decline in salaries in the second quarter of 2017 was that more jobs were located in lower-tier cities, where pay is normally lower.
| Average monthly salary for white-collar workers |
||
| Quarter |
Average salary |
Change over |
| Q2 2016 |
7,233 |
3.1% |
| Q3 2016 |
7,531 |
4.1% |
| Q4 2016 |
7,606 |
1.0% |
| Q1 2017 |
7,665 |
0.8% |
| Q2 2017 |
7,376 |
- 3.8% |
Among job postings in the second quarter of 2017, 32.8% of positions offered monthly salaries between RMB4,001 and 6,000, and 25.9% offered monthly salaries of more than RMB8,000. About 20.3% of positions offered monthly salaries between RMB2,001 and 4,000.
| Breakdown of positions by monthly salaries in the second quarter of 2017 |
|
| Salary (RMB) |
Percentage of positions |
| Over 8,000 |
25.9% |
| 6,001 to 8,000 |
19.8% |
| 4,001 to 6,000 |
32.8% |
| 2,001 to 4,000 |
20.3% |
| Below 2,000 |
1.1% |
Beijing continued to be the city with the highest pay in the second quarter of 2017, with an average monthly salary of RMB9,791, representing a drop of RMB151 from the first quarter. The average monthly salary also declined slightly in Shanghai and Shenzhen in the second quarter. The salary in Hangzhou actually went up to RMB7,933, jumping to the 4th in ranking.
| Average monthly salary for cities in the second quarter of 2017 |
|||||
| Ranking |
City |
Average |
Ranking |
City |
Average |
| 1 |
Beijing |
9,791 |
20 |
Changsha |
6,721 |
| 2 |
Shanghai |
9,337 |
21 |
Wuxi |
6,704 |
| 3 |
Shenzhen |
8,866 |
22 |
Lanzhou |
6,638 |
| 4 |
Hangzhou |
7,933 |
23 |
Kunming |
6,592 |
| 5 |
Guangzhou |
7,754 |
24 |
Nanchang |
6,538 |
| 6 |
Dongguan |
7,552 |
25 |
Hefei |
6,516 |
| 7 |
Ningbo |
7,423 |
26 |
Tianjin |
6,477 |
| 8 |
Nanjing |
7,263 |
27 |
Zhengzhou |
6,448 |
| 9 |
Urumqi |
7,230 |
28 |
Jinan |
6,447 |
| 10 |
Xiamen |
7,206 |
29 |
Qingdao |
6,343 |
| 11 |
Suzhou |
7,198 |
30 |
Dalian |
6,213 |
| 12 |
Foshan |
7,152 |
31 |
Xi'an |
6,089 |
| 13 |
Haikou |
7,145 |
32 |
Shijiazhuang |
6,027 |
| 14 |
Chongqing |
6,978 |
33 |
Taiyuan |
5,959 |
| 15 |
Guiyang |
6,918 |
34 |
Changchun |
5,871 |
| 16 |
Nanning |
6,908 |
35 |
Yantai |
5,868 |
| 17 |
Chengdu |
6,850 |
36 |
Shenyang |
5,810 |
| 18 |
Fuzhou |
6,785 |
37 |
Harbin |
5,701 |
| 19 |
Wuhan |
6,762 |
|||
The best-paying sector in the second quarter of 2017 continued to be professional services/consulting (finance and accounting, legal and Human Resources, etc.) with an average monthly salary of RMB10,165, followed by RMB9,475 for funds/securities/futures/investment and RMB9,159 for intermediary services.
| Top 10 highest paid sectors in the second quarter of 2017 |
|
| Sector |
Average monthly |
| Professional service/consulting (finance and accounting, legal and HR, etc.) |
10,165 |
| Funds/securities/futures/investment |
9,475 |
| Intermediary service |
9,159 |
| Cross-industry operation |
8,832 |
| Banking |
8,578 |
| Trust/warrant/auction/pawn |
8,339 |
| Real estate/construction/building materials/engineering |
8,305 |
| Insurance |
8,246 |
| Telecom/carrier operators/value-added service |
8,143 |
| Energy/mineral/mining/smelting |
7,934 |
The top three occupations with the highest monthly salaries in the second quarter of 2017 were senior management (RMB18,818), IT management/project coordination (RMB13,915) and securities/futures/investment management/service (RMB11,546).
| Top 10 highest paid occupations in the second quarter of 2017 |
|
| Occupation |
Average monthly |
| Senior management |
18,818 |
| IT management/project coordination |
13,915 |
| Securities/futures/investment management/service |
11,546 |
| Sales management |
10,455 |
| Civil servant/public institution/research institution |
10,168 |
| Real estate development/broker/agency |
9,979 |
| Banking |
9,665 |
| Software/internet development/system integration |
9,559 |
| Trust/warrant/auction/pawn |
9,361 |
| Project management/project coordination |
9,348 |
Wholly foreign-owned enterprises offered the highest average monthly salary of RMB8,064 in the second quarter, followed by RMB8,025 for public companies and RMB7,903 for joint ventures.
| Average monthly salaries from different types of companies in the second quarter of 2017 |
|
| Type of Company |
Average monthly |
| Wholly foreign-owned enterprises |
8,064 |
| Public companies |
8,025 |
| Joint ventures |
7,903 |
| State-owned enterprises |
7,662 |
| Private companies |
7,118 |
| Public institutions |
7,109 |
The average monthly salary of micro-sized companies with fewer than 20 employees plunged from RMB9,532 in the first quarter to RMB6,568 in the second quarter. With investment waning, many start-ups could no longer afford to offer higher salaries as before to attract talents.
| Average monthly salaries for companies of different sizes in the second quarter of 2017 |
|
| Size of company by |
Average monthly salary (RMB) |
| Below 20 |
6,568 |
| 20-99 |
7,014 |
| 100-499 |
7,217 |
| 500-999 |
7,651 |
| 1,000-9,999 |
8,098 |
| Above 10,000 |
8,097 |
Job market competition easing for white-collar workers
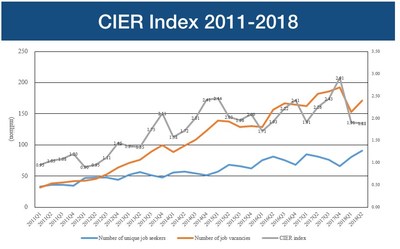
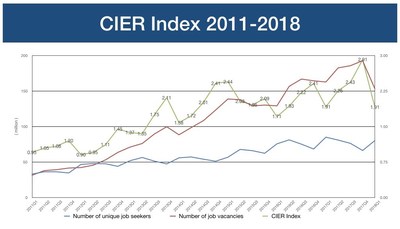
Zhaopin publishes the quarterly competitive index for the labor market based on data collected from its online platform. The competitive index is calculated based on the number of resume applications divided by the number of job vacancies. For the second quarter of 2017, the competitive index was 35.8, which means there were an average of 36 applications per job vacancy, down from 44.6 in the first quarter of 2017.
Compared with the previous four quarters, the job market competition for white-collar workers eased in the second quarter of 2017. With the aging demographic, the labor supply began to dwindle in China. Meanwhile, job seekers were more cautious and tended to submit fewer resumes than before.
| Competitive index |
|
| Quarter |
Competitive index |
| Q2 2016 |
45.1 |
| Q3 2016 |
37.8 |
| Q4 2016 |
40.3 |
| Q1 2017 |
44.6 |
| Q2 2017 |
35.8 |
(Competitive index = number of applications/number of job vacancies)
Beijing was by far the most competitive city for white-collar workers, with a competitive index of 89.9 in the second quarter of 2017, down from 96.0 in the first quarter of 2017.
| Competitive index for cities in the second quarter of 2017 |
|||||
| Ranking |
City |
Index |
Ranking |
City |
Index |
| 1 |
Beijing |
89.9 |
20 |
Zhengzhou |
20.6 |
| 2 |
Shenzhen |
48.5 |
21 |
Lanzhou |
20.5 |
| 3 |
Shanghai |
42.7 |
22 |
Wuxi |
19.0 |
| 4 |
Chengdu |
42.4 |
23 |
Haikou |
18.9 |
| 5 |
Shenyang |
42.1 |
24 |
Shijiazhuang |
18.8 |
| 6 |
Dalian |
36.3 |
25 |
Kunming |
18.0 |
| 7 |
Xi'an |
35.4 |
26 |
Guiyang |
17.1 |
| 8 |
Tianjin |
34.0 |
27 |
Hefei |
16.6 |
| 9 |
Guangzhou |
29.1 |
28 |
Jinan |
16.1 |
| 10 |
Chongqing |
28.1 |
29 |
Yantai |
14.6 |
| 11 |
Changsha |
26.9 |
30 |
Urumqi |
14.5 |
| 12 |
Wuhan |
26.8 |
31 |
Fuzhou |
14.3 |
| 13 |
Harbin |
26.8 |
32 |
Nanchang |
13.0 |
| 14 |
Suzhou |
26.7 |
33 |
Xiamen |
12.4 |
| 15 |
Hangzhou |
25.4 |
34 |
Dongguan |
12.1 |
| 16 |
Nanjing |
25.1 |
35 |
Foshan |
11.4 |
| 17 |
Changchun |
23.9 |
36 |
Nanning |
10.9 |
| 18 |
Taiyuan |
22.0 |
37 |
Ningbo |
10.0 |
| 19 |
Qingdao |
21.5 |
|||
| Competitive index = number of applications/number of job vacancies |
|||||
First-tier cities (Beijing, Shanghai, Shenzhen and Guangzhou) continued to be the top four cities with the highest job demand in the second quarter of 2017. Emerging first-tier cities, including Chengdu, Nanjing, Hangzhou, Tianjin and Xi'an, were also among the top ten cities with the highest job demand.
| Top ten cities with the highest job demand in the second quarter of 2017 |
|
| Ranking |
City |
| 1 |
Beijing |
| 2 |
Shanghai |
| 3 |
Shenzhen |
| 4 |
Guangzhou |
| 5 |
Zhengzhou |
| 6 |
Chengdu |
| 7 |
Nanjing |
| 8 |
Hangzhou |
| 9 |
Tianjin |
| 10 |
Xi'an |
The top ten cities with most job applications in the second quarter of 2017 were the same cities with the highest job demand, indicating that cities with high job demand were also attracting job seekers.
| Top ten cities with most job applications in the second quarter of 2017 |
|
| Ranking |
City |
| 1 |
Beijing |
| 2 |
Shanghai |
| 3 |
Shenzhen |
| 4 |
Chengdu |
| 5 |
Guangzhou |
| 6 |
Xi'an |
| 7 |
Tianjin |
| 8 |
Hangzhou |
| 9 |
Zhengzhou |
| 10 |
Nanjing |
In terms of employer size, companies with 1,000 to 9,999 employees were the most competitive for job seekers, with an index of 42.5, followed by 40.5 for companies with 500 to 999 employees. The competition for positions in small and micro-sized companies was relatively low due to low brand recognition.
| Competitive index for different size companies in the second quarter of 2017 |
|
| Size of Company by |
Index |
| Below 20 |
26.2 |
| 20-99 |
31.4 |
| 100-499 |
38.5 |
| 500-999 |
40.5 |
| 1,000-9,999 |
42.5 |
| Over 10,000 |
35.1 |
Supply and demand by sector
In the second quarter of 2017, the internet/e-commerce sector still topped the list with the most job vacancies, followed by real estate/construction/building materials/engineering and education/training/college sectors. The booming of artificial intelligence created huge job demand in the internet/e-commerce sector.
| Top ten sectors with the highest job demand in the second quarter of 2017 |
|
| Ranking |
Sector |
| 1 |
Internet/e-commerce |
| 2 |
Real estate/construction/building materials/engineering |
| 3 |
Education/training/college |
| 4 |
Funds/securities/futures/investment |
| 5 |
Computer software |
| 6 |
Professional service/consulting (finance and accounting, legal and HR, etc.) |
| 7 |
Trade/export and import |
| 8 |
FMCG (food, drinks, alcohol and tobacco, and chemicals for daily use) |
| 9 |
IT services (system/data/maintenance) |
| 10 |
Media/publishing/movie and TV/culture communications |
Telecommunication/carrier operators/value-added service replaced online games as the most competitive sector for job seekers in the second quarter of 2017, with 57.3 applications per vacancy. The competitive index for most sectors declined in the second quarter of 2017 from the previous quarter.
| Top ten most competitive sectors in the second quarter of 2017 |
|||
| Ranking |
Sector |
Index |
Ranking in previous quarter |
| 1 |
Telecom/carrier operators/value-added service |
57.3 |
3 |
| 2 |
Online games |
53.4 |
1 |
| 3 |
Aviation/aerospace research and manufacturing |
49.9 |
4 |
| 4 |
IT services (system/data/maintenance) |
47.8 |
5 |
| 5 |
Real estate/construction/building |
47.4 |
2 |
| 6 |
Cross-industry operation |
45.1 |
8 |
| 7 |
Computer software |
44.9 |
6 |
| 8 |
Internet/e-commerce |
42.7 |
7 |
| 9 |
Computer hardware |
42.1 |
14 |
| 10 |
Government/public service/non-profit |
41.7 |
10 |
Insurance continued to be the least competitive sector in the second quarter of 2017, with 15.5 applications per vacancy, followed by 19.4 for intermediary service and 22.1 for office supplies and equipment.
| Least competitive sectors in the second quarter of 2017 |
|
| Sector |
Index |
| Insurance |
15.5 |
| Intermediary service |
19.4 |
| Office supplies and equipment |
22.1 |
| Printing/packaging/papermaking |
23.4 |
| Home furnishing/interior design/decoration |
25.5 |
| Outsourcing service |
25.9 |
| Banking |
26.5 |
| Processing and manufacturing (raw material processing/mould) |
26.7 |
| Hotel/restaurant |
27.3 |
| Healthcare/nursing/beauty |
27.3 |
The sectors with the most job applications in the second quarter of 2017 included internet/e-commerce, computer software and real estate/construction/building materials/engineering.
| Top ten sectors with the most job applications in the second quarter of 2017 |
|
| Ranking |
Sector |
| 1 |
Internet/e-commerce |
| 2 |
Computer software |
| 3 |
Real estate/construction/building materials/engineering |
| 4 |
Funds/securities/futures/investment |
| 5 |
IT services (system/data/maintenance) |
| 6 |
Education/training/college |
| 7 |
Professional service/consulting (finance and accounting, legal and HR, etc.) |
| 8 |
Media/publishing/movie and TV/culture communications |
| 9 |
FMCG (food, drinks, alcohol and tobacco, and chemicals for daily use) |
| 10 |
Trade/export and import |
Supply and demand by occupation
The top occupations with the most vacancies for white collar workers in the second quarter of 2017 were almost the same as in the first quarter of 2017, including sales, administration/logistics/secretary, and software/internet development/system integration.
| Top ten occupations with the highest job demand in the second quarter of 2017 |
|
| Ranking |
Occupation |
| 1 |
Sales |
| 2 |
Administration/logistics/secretary |
| 3 |
Software/internet development/system integration |
| 4 |
Sales management |
| 5 |
Education/training |
| 6 |
Finance/auditing/tax |
| 7 |
Customer service/pre-sales and after-sales support |
| 8 |
Human resources |
| 9 |
Civil engineering/construction/decoration/municipal engineering |
| 10 |
Marketing |
The most competitive occupation in the second quarter of 2017 was software/internet development/system integration with 122.7 applications per vacancy, followed by 88.4 for IT quality management/testing/configuration management, and 67.4 for finance/auditing/tax.
| Top 10 most competitive occupations in the second quarter of 2017 |
|||
| Ranking |
Occupation |
Index |
Ranking in previous quarter |
| 1 |
Software/internet development/system integration |
122.7 |
1 |
| 2 |
IT quality management/testing/configuration management |
88.4 |
4 |
| 3 |
Finance/auditing/tax |
67.4 |
2 |
| 4 |
Transportation services |
60.4 |
5 |
| 5 |
Senior management |
58.2 |
6 |
| 6 |
Human resources |
53.6 |
7 |
| 7 |
Civil engineering/construction/decoration/municipal engineering |
51.2 |
3 |
| 8 |
Administration/logistics/secretary |
44.6 |
9 |
| 9 |
IT management/project coordination |
42.6 |
14 |
| 10 |
Purchasing/trade |
42.0 |
8 |
The least competitive occupations in the second quarter of 2017 were healthcare/beauty/hairdressing/bodybuilding with 9.6 applications per vacancy, followed by 12.4 for community/residency/housekeeping, and 12.7 for insurance.
| Least competitive occupations in the second quarter of 2017 |
|
| Occupation |
Index |
| Healthcare/beauty/hairdressing/bodybuilding |
9.6 |
| Community/residency/housekeeping |
12.4 |
| Insurance |
12.7 |
| Sales |
12.9 |
| Cooking/catering/food R&D |
14.4 |
| Mechanic/operator |
15.1 |
| Hospital/medical care/nursing |
15.7 |
| Education/training |
16.1 |
| Farming/forestry/animal husbandry/fishery |
16.5 |
| Customer service/pre-sales and after-sales |
18.3 |
The top ten occupations with the most job applications in the second quarter of 2017 were the same as in the first quarter of 2017 with some changes in rankings.
| Top ten occupations with the most job applications in the second quarter of 2017 |
|
| Ranking |
Occupation |
| 1 |
Software/internet development/system integration |
| 2 |
Finance/auditing/tax |
| 3 |
Administration/logistics/secretary |
| 4 |
Human resources |
| 5 |
Civil engineering/construction/decoration/municipal engineering |
| 6 |
Sales |
| 7 |
Internet product/operation management |
| 8 |
Art/design |
| 9 |
Sales management |
| 10 |
Purchasing/trade |
About Zhaopin Limited
Zhaopin is a leading career platform in China, focusing on connecting users with relevant job opportunities throughout their career lifecycle. The Company's zhaopin.com website is the most popular career platform in China as measured by average daily unique visitors in each of the 12 months ended March 31, 2017, number of registered users as of March 31, 2017 and number of unique customers[2] for the three months ended March 31, 2017. The Company's over 135.0 million registered users include diverse and educated job seekers who are at various stages of their careers and are in demand by employers as a result of the general shortage of skilled and educated workers in China. In the fiscal year ended June 30, 2016, approximately 36.9 million job postings[3] were placed on Zhaopin's platform by 509,813 unique customers including multinational corporations, small and medium-sized enterprises and state-owned entities. The quality and quantity of Zhaopin's users and the resumes in the Company's database attract an increasing number of customers. This in turn leads to more users turning to Zhaopin as their primary recruitment and career- related services provider, creating strong network effects and significant entry barriers for potential competitors. For more information, please visit http://www.zhaopin.com.
Safe Harbor Statements
This press release contains forward-looking statements made under the "safe harbor" provisions of Section 21E of the Securities Exchange Act of 1934, as amended, and the U.S. Private Securities Litigation Reform Act of 1995. These forward-looking statements can be identified by terminology such as "will," "expects," "anticipates," "future," "intends," "plans," "believes," "estimates," "confident" and similar statements. Zhaopin may also make written or oral forward-looking statements in its reports filed with or furnished to the U.S. Securities and Exchange Commission, in its annual report to shareholders, in press releases and other written materials and in oral statements made by its officers, directors or employees to third parties. Any statements that are not historical facts, including statements about Zhaopin's beliefs and expectations, are forward-looking statements that involve factors, risks and uncertainties that could cause actual results to differ materially from those in the forward-looking statements. Such factors and risks include, but not limited to the following: Zhaopin's goals and strategies; its future business development, financial condition and results of operations; its ability to retain and grow its user and customer base for its online career platform; the growth of, and trends in, the markets for its services in China; the demand for and market acceptance of its brand and services; competition in its industry in China; its ability to maintain the network infrastructure necessary to operate its website and mobile applications; relevant government policies and regulations relating to the corporate structure, business and industry; and its ability to protect its users' information and adequately address privacy concerns. Further information regarding these and other risks, uncertainties or factors is included in the Company's filings with the U.S. Securities and Exchange Commission. All information provided in this press release is current as of the date of the press release, and Zhaopin does not undertake any obligation to update such information, except as required under applicable law.
| [1] Zhaopin's website is the most popular career platform in China as measured by average daily unique visitors in each of the 12 months ended March 31, 2017, the number of registered users as of March 31, 2017 and the number of unique customers for the three months ended March 31, 2017. |
| [2] A "unique customer" refers to a customer that purchases the Company's online recruitment services during a specified period. Zhaopin makes adjustments for multiple purchases by the same customer to avoid double counting. Each customer is assigned a unique identification number in the Company's information management system. Affiliates and branches of a given customer may, under certain circumstances, be counted as separate unique customers. |
| [3] Zhaopin calculates the number of job postings by counting the number of newly placed job postings during each respective period. Job postings that were placed prior to a specified period - even if available during such period - are not counted as job postings for such period. Any particular job posting placed on the Company's website may include more than one job opening or position. |
For more information, please contact:
Zhaopin Limited
Ms. Daisy Wang
Investor Relations
ir@zhaopin.com.cn
ICR Beijing
Mr. Edmond Lococo
Phone: +86 10 6583-7510
Edmond.Lococo@icrinc.com
View original content:http://www.prnewswire.com/news-releases/china-white-collar-average-salary-declined-in-the-second-quarter-of-2017-300488909.html