BEIJING, Nov. 7, 2017 /PRNewswire/ -- Zhaopin Limited ("Zhaopin" or the "Company"), a leading career platform in China focused on connecting users with relevant job opportunities through their career lifecycle, and the China Institute for Employment Research ("CIER") at Renmin University released the CIER Employment Index Report for the third quarter of 2017.
With the steady growth of the overall economy in the third quarter of 2017, the labor market in China continued to boom, with increased demand for labor, and a decline in job applicants.
China's Third-Quarter 2017 Labor Market Highlights:
Methodology and how to interpret the data
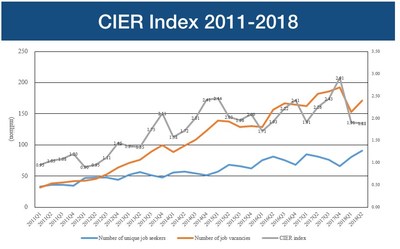
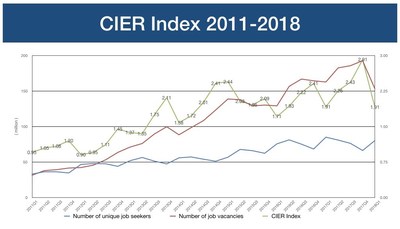
Based on data from Zhaopin's online recruitment platform, the CIER index tracks the ratio changes between job vacancies and job seekers in a variety of industries and cities across the country, and identifies the overall trend in China's employment market. Jointly published by Zhaopin and the CIER at Renmin University every quarter, the CIER index has become a leading barometer of China's labor market and macro-economic environment.
The CIER index score is calculated by dividing the number of job vacancies during a specified period by the number of unique job seekers during the same period. A CIER index score of more than 1 indicates that the labor market is booming, with more vacancies than job seekers. A CIER index score of less than 1 indicates that the labor market competition is intensifying, with more job seekers than available vacancies.
CIER index gaining momentum with growing economy
In the third quarter of 2017, the economy in China continued to grow steadily with the GDP increasing by 6.8% year-over-year. Driven by the growing economy, the CIER index for the labor market rose to 2.43 in the third quarter of 2017, up from 2.26 in the second quarter and 1.91 in the first quarter of 2017. The CIER index in the third quarter of 2017 was also higher than the score of 2.22 in the same period of 2016.
The upward momentum in the CIER index was caused by increasing labor demand, and a decline in job seekers in the third quarter. The steady economic growth created more job demand in the country. According to Zhaopin's data, total online recruitment demand in China rose 47% year-over-year in the third quarter of 2017, compared with a 36% year-over-year growth in the second quarter of 2017. Meanwhile, the number of job seekers declined in the third quarter over the previous quarter, as it was the traditional slow season for job hopping.

CIER Index 2011-2017
CIER index by sectors
The gap between best-performing sectors and worst-performing sectors widened in the third quarter of 2017. The CIER index of the best performing sector was 28 times better than that of the worst performing sector.
The internet/e-commerce sector continued to be the best-performing sector in the third quarter of 2017 with CIER index rising to 12.62 from 9.06 in the second quarter. The job demand surged 31.7% for the sector in the third quarter, while applicants declined by 5.5% over the previous quarter. Traffic/transportation, insurance and intermediary service also performed well in the third quarter.
| Ten best-performing sectors in the third quarter of 2017 |
||
| Ranking |
Sector |
CIER index |
| 1 |
Internet/e-commerce |
12.62 |
| 2 |
Traffic/transportation |
7.31 |
| 3 |
Insurance |
6.12 |
| 4 |
Intermediary service |
6.04 |
| 5 |
Media/publishing/movie and TV/culture communications |
5.51 |
| 6 |
Logistics/warehousing |
4.87 |
| 7 |
Electronics/semiconductor/integrated circuit |
4.21 |
| 8 |
Farming/forestry/animal husbandry/fishery |
3.87 |
| 9 |
Funds/securities/futures/investment |
3.74 |
| 10 |
Professional service/consulting (finance and accounting, legal |
3.60 |
Most of the worst-performing sectors were traditional manufacturing industries suffering from over-capacity. Surprisingly, the CIER index of energy/mineral/mining/smelting sector jumped to 1.84 in the third quarter from 0.60 in the second quarter, lifting it out of the worst-performing list. As the sector was trying to cut capacity, the job demand rebounded with increasing prices for steel and coal in the third quarter.
| Ten worst-performing sectors in the third quarter of 2017 |
||
| Ranking |
Sector |
CIER index |
| 1 |
Electricity/power/water conservancy |
0.45 |
| 2 |
Aerospace research and manufacturing |
0.51 |
| 3 |
Inspection/testing/authentication |
0.59 |
| 4 |
Printing/packaging/papermaking |
0.61 |
| 5 |
Office supplies and equipment |
0.64 |
| 6 |
Environmental protection |
0.72 |
| 7 |
Property management/business center |
0.80 |
| 8 |
Instruments/apparatuses/industrial automation |
0.89 |
| 9 |
Medical equipment/apparatus and instruments |
0.91 |
| 10 |
Leasing service |
0.94 |
The traffic/transportation sector continued to enjoy fast growth as a pillar industry in China. Job demand in the sector jumped 58% in the third quarter of 2017 year-over-year, driven by surging demand from second-tier and third-tier cities.
| Year-over-year change in recruitment demand for |
|
| Nationwide |
58% |
| First-tier cities |
-19% |
| Emerging first-tier cities |
29% |
| Second-tier cities |
118% |
| Third-tier cities |
182% |
The IT and internet sector saw the job demand soar 60% in the third quarter of 2017 year-over-year. The recruitment demand in emerging first-tier cities more than doubled as the internet industry were fast expanding from first-tier cities to emerging first-tier cities.
| Year-over-year change in recruitment demand for |
|
| Nationwide |
60% |
| First-tier cities |
-2% |
| Emerging first-tier cities |
121% |
| Second-tier cities |
46% |
| Third-tier cities |
82% |
The financial sector suffered a 25% drop in job demand in the third quarter of 2017 year-over-year, and the demand in first-tier cities tumbled by 54% in the quarter. Facing the competition from internet finance companies, many traditional financial institutions had to lay off lower-level staff to improve efficiency. As the government tightened supervision with more regulations, internet finance companies were also more cautious with expansion.
| Year-over-year change in recruitment demand for |
|
| Nationwide |
-25% |
| First-tier cities |
-54% |
| Emerging first-tier cities |
-6% |
| Second-tier cities |
14% |
| Third-tier cities |
65% |
Professional service/consulting sector witnessed explosive growth with job demand surging 62% in the third quarter of 2017 year-over-year. The growth was primarily driven by demand from emerging first-tier cities, which needed professional services to support their fast development.
| Year-over-year change in recruitment demand for professional |
|
| Nationwide |
62% |
| First-tier cities |
6% |
| Emerging first-tier cities |
113% |
| Second-tier cities |
92% |
| Third-tier cities |
165% |
CIER index by regions and cities1
In the third quarter of 2017, Eastern China continued to enjoy the highest CIER index score of 2.14, followed by 1.92 for Central China and 1.63 for Western China. Among all regions, Central China had the fastest growth in job demand at 81% year-over-year in the third quarter of 2017, followed by 78% increase for Western China and 57% for Northeast China.
| CIER index by regions |
|||
| Region |
3Q 2017 CIER |
3Q 2016 CIER |
2Q 2017 CIER |
| Eastern China |
2.14 |
1.75 |
2.03 |
| Central China |
1.92 |
1.69 |
1.76 |
| Western China |
1.63 |
1.59 |
1.67 |
| Northeast China |
1.42 |
1.40 |
1.33 |
Compared with the second quarter, the CIER index increased for cities of all tiers in the third quarter of 2017, except for first-tier cites. The CIER index for first-tier cities was 0.68 in the third quarter, indicating a saturated labor market. The job demand in first-tier cities actually dropped by 7% year-over-year in the third quarter.
| CIER index by cities |
|||
| City |
3Q 2017 CIER |
3Q 2016 CIER |
2Q 2017 CIER |
| First-tier cities |
0.68 |
0.80 |
0.97 |
| Emerging first-tier cities |
1.31 |
1.34 |
1.30 |
| Second-tier cities |
2.15 |
1.63 |
2.08 |
| Third-tier cities |
2.92 |
2.22 |
2.53 |
| 1 Cities are categorized to tiers based on standard of CBN Weekly. First-tier cities include Beijing, Shanghai, Guangzhou and Shenzhen. Emerging first-tier cities include Chengdu, Dalian, Dongguan, Hangzhou, Nanjing, Ningbo, Qingdao, Shenyang, Suzhou, Tianjin, Wuhan, Xi'an, Changsha, Zhengzhou, and Chongqing. Second-tier cities include Changzhou, Foshan, Fuzhou, Guiyang, Harbin, Hefei, Huizhou, Jinan, Jiaxing, Kunming, Nanchang, Nanning, Nantong, Quanzhou, Shijiazhuang, Taiyuan, Weifang, Wenzhou, Wuxi, Xuzhou, Yantai, Yangzhou, Changchun, Zhongshan, Zhuhai. Third-tier cities include Baotou, Daqing, Hohhot, Huai'an, Linyi, Luoyang, Qinhuangdao, Weihai, Xianyang and Zhenjiang. |
CIER index by size of companies
In the third quarter of 2017, the CIER index grew for small and micro-sized companies compared with the second quarter, while the CIER index declined for large and medium-sized companies. Medium and small-sized companies posted the strongest growth in job demand with 55% and 49% year-over-year respectively in the third quarter.
| CIER index by size of companies |
|||
| Company size |
3Q 2017 |
3Q 2016 |
2Q 2017 |
| Large-sized (more than 10,000 employees) |
1.90 |
1.42 |
2.46 |
| Medium-sized (500 to 9,999 employees) |
1.01 |
1.01 |
1.25 |
| Small-sized (20 to 499 employees) |
1.42 |
0.84 |
1.10 |
| Micro-sized (fewer than 20 employees) |
2.27 |
3.11 |
2.15 |
CIER index by type of companies
Private companies enjoyed the highest CIER index of 1.68 in the third quarter of 2017, followed by 1.50 for shareholding companies. Wholly foreign-owned enterprises suffered with the lowest CIER of 0.59 in the third quarter. According to Zhaopin data, job demand increased by 47% and 77% for private companies and shareholding companies, respectively, year-over-year in the third quarter. China's internet giants and most high-tech companies are private or shareholding companies, and their robust growth created more demand for talent.
| CIER index by type of companies |
||
| Company size |
3Q 2017 |
2Q 2017 |
| Private companies |
1.68 |
1.34 |
| Shareholding companies |
1.50 |
1.33 |
| Joint ventures |
1.35 |
1.42 |
| Wholly foreign-owned enterprises |
0.59 |
0.74 |
| State-owned enterprises |
1.25 |
1.50 |
| Public companies |
0.65 |
0.95 |
Labor Market Outlook
The CIER index is expected to continue its upward trend in the fourth quarter of 2017.

CIER Index Outlook
For more information, please contact:
Zhaopin Limited
Ms. Daisy Wang
Investor Relations
ir@zhaopin.com.cn
ICR Beijing
Mr. Edmond Lococo
Phone: +86 10 6583-7510
Edmond.Lococo@icrinc.com
View original content with multimedia:http://www.prnewswire.com/news-releases/china-labor-market-boom-continued-in-the-third-quarter-of-2017-300550590.html