NANJING, China, March 28, 2016 /PRNewswire/ -- Ever-Glory International Group, Inc. (the "Company" or "Ever-Glory") (NASDAQ-GM: EVK), a retailer of branded fashion apparel and a leading global apparel supply chain solution provider, today reported its financial results for the fourth quarter and full year ended December 31, 2015.
Mr. Yihua Kang, Chairman, President and Chief Executive Officer of Ever-Glory, said, "During 2015, soft global economy and Chinese retail conditions led to a challenging consumer environment, impacting sales in both our wholesale and retail businesses. Nevertheless, our product development and supply chain management capability continued to gain recognition among high quality mid-to-high end wholesale customers both domestically and internationally in 2015."
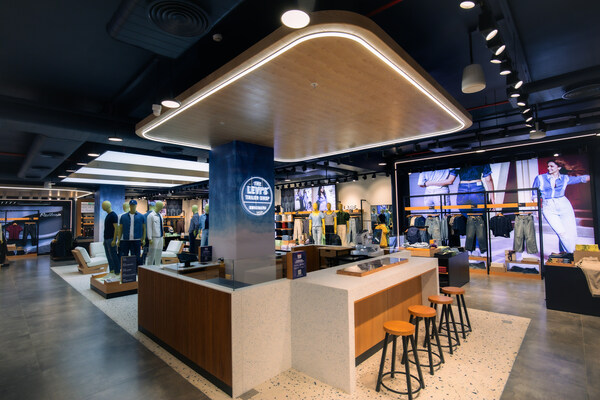
"For our retail business, we remain focused on the retail network expansion, as we opened 228 stores in China during 2015. In addition, to further enhance our profitability, and improve our store performance and operating efficiency, we made the decision to optimize our retail network by closing 270 underperforming stores and remodeling or relocating 216 stores in 2015, while enhancing our product development and retail store management. Following the 2014 introduction of our two new retail brands, Velwin and Sea To Sky, and the 2015 introduction of our latest brand idole, we had a network of 1,159 retail stores across over 300 cities in China, at the end of 2015. Heading into 2016, we continue to execute on our multi-brand strategy to increase our competitiveness and market share."
"While we expect economic pressures to persist, we remain optimistic regarding our future growth opportunities. With a wholesale strategy focused on mid-to-high end customer base expansion, supply chain management refinement and manufacturing process optimization, and a retail strategy focused on retail store management and customer-driven product development, we believe our efforts will support the long-term sustainability of our overall business," concluded Mr. Kang.
Mr. Jason Jiansong Wang, Chief Financial Officer of Ever-Glory, added, "We are pleased with our improvement in gross margin in 2015 from last year. While the market weakness impacted our topline results, we enacted several strategic initiatives throughout the year, including optimizing retail store network, increasing marketing and promotional activities and developing online channels. Going forward, we believe our efforts will help ensure the growth of Ever-Glory over the long-run as market conditions improve, and we continue to remain focused on maximizing our profitability through disciplined expense management."
Fourth Quarter 2015 Financial Results
Total sales for the fourth quarter of 2015 were $129.2 million, a 0.5% increase from $128.5 million in the fourth quarter of 2014. This increase was primarily due to a 4.4% increase in wholesale sales, partially offset by a 2.9% decrease in retail sales.
Retail sales from the Company's branded fashion apparel retail division decreased by 2.9% to $67.0 million for the fourth quarter of 2015, compared with $68.9 million for the fourth quarter of 2014. This decrease was primarily due to the decrease in same-store sales and the number of retail stores. We had 1,159 retail stores as of December 31, 2015, compared with 1,201 retail stores as of December 31, 2014.
Wholesale sales from the Company's wholesale business increased by 4.4% to $62.2 million for the fourth quarter of 2015, compared with $59.6 million for the fourth quarter of 2014. This increase was primarily due to increased sales in China and Europe, partially offset by decreased sales in Germany, the United Kingdom, the United States and Japan.
Total gross profit for the fourth quarter of 2015 increased by 9.1% to $36.3 million, compared with $33.3 million for the fourth quarter of 2014. Total gross margin increased by 220 basis points to 28.1% from 25.9% for the fourth quarter of 2014.
Gross profit for retail business increased by 5.1% to $24.7 million for the fourth quarter of 2015, compared with $23.5 million for the fourth quarter of 2014. Gross margin increased by 280 basis points to 36.9% from 34.1% for the fourth quarter of 2014.
Gross profit for wholesale business increased by 18.6% to $11.6 million for the fourth quarter of 2015, compared with $9.8 million for the fourth quarter of 2014. Gross margin increased by 220 basis points to 18.6% from 16.4% for the fourth quarter of 2014.
Selling expenses for the fourth quarter of 2015 increased by 0.5% to $19.5 million, or 15.1% of total sales, compared with $19.4 million, or 15.1% of total sales for the fourth quarter of 2014.
General and administrative expenses for the fourth quarter of 2015 increased by 33.4% to $12.1 million, or 9.4% of total sales, compared with $9.1 million, or 7.1% of total sales for the fourth quarter of 2014. The increase was mainly due to an increase in the number of wholesale and retail management personnel, and the depreciation and amortization of the new logistics center.
Income from operations for the fourth quarter of 2015 decreased by 2.5% to $4.7 million compared with $4.8 million for the fourth quarter of 2014.
Net income attributable to the Company for the fourth quarter of 2015 increased by 42.3% to $4.7 million compared with $3.3 million for the fourth quarter of 2014. Basic and diluted earnings per share were $0.32 and $0.22 for the fourth quarter of 2015 and 2014, respectively.
Full Year 2015 Financial Results
Total sales for the full year of 2015 were $421.4 million, an 8.4% decrease from $460.1 million in the full year of 2014. This decrease was primarily due to an 8.8% decrease in wholesale sales and an 8.1% decrease in retails sales.
Retail sales from the Company's branded fashion apparel retail division decreased by 8.1% to $224.8 million for the full year of 2015, compared with $244.7 million for the full year of 2014. This decrease was primarily due to decreased same-store sales and number of retail stores.
Wholesale sales from the Company's wholesale business decreased by 8.8% to $196.6 million for the full year of 2015, compared with $215.5 million for the full year of 2014. This decrease was primarily attributable to decreased sales in Germany, the United Kingdom, Europe and Japan, partially offset by increased sales in China and the United States.
Total gross profit for the full year of 2015 increased by 5.8% to $129.3 million, compared with $122.2 million for the full year of 2014. Total gross margin for the full year of 2015 increased by 410 basis points to 30.7% from 26.6% for the full year of 2014.
Gross profit for retail business increased by 10.2% to $94.4 million for the full year of 2015, compared with $85.6 million for the full year of 2014. Gross margin for the full year of 2015 increased by 700 basis points to 42.0% from 35.0% for the full year of 2014.
Gross profit for wholesale business decreased by 4.7% to $34.9 million for the full year of 2015, compared with $36.6 million for the full year of 2014. Gross margin for the full year of 2015 increased by 70 basis points to 17.7% from 17.0% for the full year of 2014.
Selling expenses for the full year of 2015 increased by 13.0% to $76.5 million, or 18.2% of total sales, compared with $67.7 million, or 14.7% of total sales for the full year of 2014.
General and administrative expenses for the full year of 2015 increased by 9.9% to $36.0 million, or 8.5% of total sales, compared with $32.7 million, or 7.1% of total sales for the full year of 2014. The increase was mainly due to an increase in the number of wholesale and retail management personnel, and the depreciation and amortization of the new logistics center.
Income from operations for the full year of 2015 decreased by 23.0% to $16.8 million compared with $21.8 million for the full year of 2014.
Net income attributable to the Company for the full year of 2015 decreased by 17.1% to $13.6 million compared with $16.4 million for the full year of 2014. Basic and diluted earnings per share were $0.92 and $1.11 for the full year of 2015 and 2014, respectively.
Balance Sheet
As of December 31, 2015, Ever-Glory had approximately $22.7 million of cash and cash equivalents, compared with approximately $34.1 million as of December 31, 2014. Ever-Glory had working capital of approximately $53.7 million as of December 31, 2015, and outstanding bank loans of approximately $44.8 million as of December 31, 2015.
Conference Call
The Company will hold a conference call at 8:00 a.m. Eastern Time on March 28, 2016 (8:00 p.m. Beijing Time on March 28, 2016). Listeners can access the conference call by dialing +1-888-481-2877 or +1-719-457-2648 and referring to the confirmation code 4988655. The conference call will also be webcast live over the Internet and can be accessed at the Company's website at http://www.everglorygroup.com.
A replay of the call will be available from 11:00 a.m. Eastern Time on March 28 through 11:59 p.m. Eastern Time on April 4 by calling +1-877-870-5176 or +1-858-384-5517 with pin number 4988655.
About Ever-Glory International Group, Inc.
Based in Nanjing, China, Ever-Glory International Group, Inc. is a retailer of branded fashion apparel and a leading global apparel supply chain solution provider. Ever-Glory is the first Chinese apparel Company listed on the American Stock Exchange (now named as NYSE MKT) in July 2008 and then transferred to The NASDAQ Global Market on December 31, 2014. Ever-Glory offers apparel to woman under its own brands "La go go", "Velwin", "Sea To Sky" and "idole" in China. Ever-Glory is also a leading global apparel supply chain solution provider with a focus on middle-to-high end casual wear, outerwear, and sportswear brands. Ever-Glory services a number of well-known brands and retail stores by providing a complete set of services of supply chain management on fabric development and design, sampling, sourcing, quality control, manufacturing, logistics, customs clearance and distribution.
Forward-Looking Statements
Certain statements in this release and other written or oral statements made by or on behalf of Ever-Glory International Group, Inc. (the "Company") are "forward looking statements" within the meaning of the federal securities laws. Statements regarding future events and developments and the Company's future performance, as well as management's expectations, beliefs, plans, estimates or projections relating to the future, are forward-looking statements within the meaning of these laws. The forward looking statements are subject to a number of risks and uncertainties including, without limitation, market acceptance of the Company's products and offerings, development and expansion of the Company's wholesale and retail operations, the Company's continued access to capital, currency exchange rate fluctuation and other risks and uncertainties. The actual results the Company achieves (including, without limitation, the results stemming from the future implementation of the Company's strategies and the revenue, net income and new retail store projections set forth herein) may differ materially from those contemplated by any forward-looking statements due to such risks and uncertainties (many of which are beyond the Company's control). These statements are based on management's current expectations and speak only as of the date of such statements. Readers should carefully review the risks and uncertainties described in the Company's latest Annual Report on Form 10-K and other documents that the Company files from time to time with the U.S. Securities and Exchange Commission. The Company undertakes no obligation to publicly update any forward-looking statements, whether as a result of new information, future events or otherwise, except as required by applicable law.
For investor and media inquiries, please contact:
Ever-Glory International Group
Yanhua Huang
Tel: +86-25-52096875
E-Mail: xxnfff@126.com
The Piacente Group, Inc.
Emilie Wu
China: +86-10-6535-0148
US: +1-212-481-2050
E-Mail: everglory@tpg-ir.com
EVER-GLORY INTERNATIONAL GROUP, INC. AND SUBSIDIARIES |
|||||||
CONSOLIDATED BALANCE SHEETS |
|||||||
(In thousands of U.S. Dollars, except share and per share data or otherwise stated) |
|||||||
AS OF DECEMBER 31, 2015 AND 2014 |
|||||||
2015 |
2014 |
||||||
ASSETS |
|||||||
CURRENT ASSETS |
|||||||
Cash and cash equivalents |
$ |
22,702 |
$ |
34,134 |
|||
Accounts receivable |
87,527 |
91,875 |
|||||
Inventories |
75,063 |
70,270 |
|||||
Value added tax receivable |
2,736 |
2,697 |
|||||
Other receivables and prepaid expenses |
3,840 |
3,524 |
|||||
Advances on inventory purchases |
6,193 |
3,917 |
|||||
Amounts due from related parties |
2,535 |
1,652 |
|||||
Total Current Assets |
200,596 |
208,069 |
|||||
INTANGIBLE ASSETS |
6,217 |
4,041 |
|||||
PROPERTY AND EQUIPMENT, NET |
21,906 |
20,103 |
|||||
TOTAL ASSETS |
$ |
228,719 |
$ |
232,213 |
|||
LIABILITIES AND STOCKHOLDERS' EQUITY |
|||||||
CURRENT LIABILITIES |
|||||||
Bank loans |
$ |
44,841 |
$ |
60,217 |
|||
Accounts payable |
66,118 |
58,923 |
|||||
Accounts payable and other payables - related parties |
2,823 |
3,896 |
|||||
Other payables and accrued liabilities |
22,221 |
20,911 |
|||||
Value added and other taxes payable |
6,882 |
6,217 |
|||||
Income tax payable |
4,052 |
5,523 |
|||||
Total Current Liabilities |
146,937 |
155,687 |
|||||
NONCURRENT LIABILITIES |
|||||||
Deferred tax liabilities |
2,992 |
3,874 |
|||||
TOTAL LIABILITIES |
149,929 |
159,561 |
|||||
COMMITMENTS AND CONTINGENCIES |
|||||||
STOCKHOLDERS' EQUITY |
|||||||
Stockholders' equity: |
|||||||
Preferred stock ($.001 par value, authorized 5,000,000 shares, no shares issued and outstanding) |
- |
- |
|||||
Common stock ($.001 par value, authorized 50,000,000 shares, 14,785,868 and 14,784,094 shares issued and |
15 |
15 |
|||||
Additional paid-in capital |
3,597 |
3,587 |
|||||
Retained earnings |
78,439 |
67,660 |
|||||
Statutory reserve |
15,327 |
12,537 |
|||||
Accumulated other comprehensive income |
3,249 |
8,277 |
|||||
Amounts due from related party |
(21,776) |
(19,424) |
|||||
Total equity attributable to stockholders of the Company |
78,851 |
72,652 |
|||||
Noncontrolling interest |
(61) |
- |
|||||
Total Equity |
78,790 |
72,652 |
|||||
TOTAL LIABILITIES AND STOCKHOLDERS' EQUITY |
$ |
228,719 |
$ |
232,213 |
|||
EVER-GLORY INTERNATIONAL GROUP, INC. AND SUBSIDIARIES |
||||||
CONSOLIDATED STATEMENTS OF INCOME AND COMPREHENSIVE INCOME |
||||||
(In thousands of U.S. Dollars, except share and per share data or otherwise stated) |
||||||
FOR THE YEARS ENDED DECEMBER 31, 2015 AND 2014 |
||||||
2015 |
2014 |
|||||
SALES |
$ |
421,389 |
$ |
460,141 |
||
COST OF SALES |
292,090 |
337,893 |
||||
GROSS PROFIT |
129,299 |
122,248 |
||||
OPERATING EXPENSES |
||||||
Selling expenses |
76,537 |
67,730 |
||||
General and administrative expenses |
35,956 |
32,704 |
||||
Total operating expenses |
112,493 |
100,434 |
||||
INCOME FROM OPERATIONS |
16,806 |
21,814 |
||||
OTHER INCOME (EXPENSE) |
||||||
Interest income |
1,001 |
1,238 |
||||
Interest expense |
(2,689) |
(3,269) |
||||
Other income |
3,241 |
2,060 |
||||
Total other income (expense) |
1,553 |
29 |
||||
INCOME BEFORE INCOME TAX EXPENSE |
18,359 |
21,843 |
||||
INCOME TAX EXPENSE |
(5,054) |
(5,477) |
||||
NET INCOME |
13,305 |
16,366 |
||||
Net (income) loss attributable to the non-controlling interest |
264 |
- |
||||
NET INCOME ATTRIBUTABLE TO THE COMPANY |
$ |
13,569 |
$ |
16,366 |
||
NET INCOME |
$ |
13,305 |
$ |
16,366 |
||
Foreign currency translation (loss) gain |
(5,029) |
(506) |
||||
COMPREHENSIVE INCOME |
$ |
8,276 |
$ |
15,860 |
||
Comprehensive (income) loss attributable to the noncontrolling interest |
265 |
- |
||||
COMPREHENSIVE INCOME ATTRIBUTABLE TO THE COMPANY |
$ |
8,541 |
$ |
15,860 |
||
EARNINGS PER SHARE: |
||||||
Basic and diluted |
$ |
0.92 |
$ |
1.11 |
||
Weighted average number of shares outstanding basic and diluted |
14,784,847 |
14,782,320 |
||||
EVER-GLORY INTERNATIONAL GROUP, INC. AND SUBSIDIARIES |
||||||
CONSOLIDATED STATEMENTS OF CASH FLOWS |
||||||
(In thousands of U.S. Dollars, except share and per share data or otherwise stated) |
||||||
FOR THE YEARS ENDED DECEMBER 31, 2015 AND 2014 |
||||||
2015 |
2014 |
|||||
CASH FLOWS FROM OPERATING ACTIVITIES |
||||||
Net income |
$ |
13,305 |
$ |
16,366 |
||
Adjustments to reconcile net income to cash provided by operating activities: |
||||||
Depreciation and amortization |
8,495 |
7,532 |
||||
Provision for obsolete inventories |
3,690 |
4,967 |
||||
Loss from sale of property and equipment |
(28) |
- |
||||
Provision for doubtful accounts |
503 |
1,789 |
||||
Deferred income tax |
(708) |
(3,471) |
||||
Stock-based compensation |
10 |
15 |
||||
Changes in operating assets and liabilities |
||||||
Accounts receivable |
(491) |
(13,850) |
||||
Inventories |
(12,261) |
(511) |
||||
Value added tax receivable |
(187) |
(95) |
||||
Other receivables and prepaid expenses |
(524) |
(1,767) |
||||
Advances on inventory purchases |
(2,582) |
2,055 |
||||
Amounts due from related parties |
(1,359) |
240 |
||||
Accounts payable |
10,836 |
(13,459) |
||||
Accounts payable and other payables- related parties |
(1,829) |
(1,285) |
||||
Other payables and accrued liabilities |
2,460 |
4,897 |
||||
Value added and other taxes payable |
1,030 |
838 |
||||
Income tax payable |
(1,230) |
5,061 |
||||
Net cash provided by operating activities |
19,130 |
9,322 |
||||
CASH FLOWS FROM INVESTING ACTIVITIES |
||||||
Purchases of property and equipment |
(11,385) |
(9,477) |
||||
Proceeds from sale of property and equipment |
67 |
161 |
||||
Purchase of land use rights |
(1,475) |
(1,314) |
||||
Acquisition of Yiduo net of cash acquired |
(690) |
- |
||||
Net cash used in investing activities |
(13,483) |
(10,630) |
||||
CASH FLOWS FROM FINANCING ACTIVITIES |
||||||
Proceeds from bank loans |
136,910 |
138,413 |
||||
Repayment of bank loans |
(149,791) |
(131,173) |
||||
Repayment of loans from related party |
2,405 |
4,358 |
||||
Advances to related party |
(4,873) |
(5,044) |
||||
Interest income received from related party |
- |
1,302 |
||||
Net cash provided by (used in) financing activities |
(15,349) |
7,856 |
||||
EFFECT OF EXCHANGE RATE CHANGES ON CASH |
(1,730) |
(186) |
||||
NET INCREASE IN CASH AND CASH EQUIVALENTS |
(11,432) |
6,361 |
||||
CASH AND CASH EQUIVALENTS AT BEGINNING OF PERIOD |
34,134 |
27,773 |
||||
CASH AND CASH EQUIVALENTS AT END OF PERIOD |
$ |
22,702 |
$ |
34,134 |
||
SUPPLEMENTAL DISCLOSURE OF CASH FLOW INFORMATION: |
||||||
Cash paid during the period for: |
||||||
Accrued interest income on amounts due from related party under counter-guarantee agreement |
$ |
888 |
$ |
1,075 |
||
Interest |
$ |
2,627 |
$ |
3,269 |
||
Income taxes |
$ |
6,993 |
$ |
3,905 |
||
SUPPLEMENTAL INFORMATION OF NONCASH INVESTING ACTIVITIES |
||||||
Increase in intangible assets and non-controlling interests |
$ |
233 |
$ |
- |
||
To view the original version on PR Newswire, visit:http://www.prnewswire.com/news-releases/ever-glory-reports-fourth-quarter-and-full-year-2015-financial-results-300241818.html