ONTARIO, Canada, November 22, 2011 /PRNewswire-Asia-FirstCall/ -- Canadian Solar Inc. (the "Company", or "Canadian Solar") (NASDAQ: CSIQ), one of the world's largest solar companies, today announced financial results for the third quarter ended September 30, 2011.
Third Quarter 2011 Highlights
Third Quarter 2011 Results
Net revenue for the third quarter of 2011 was $499.6 million, up 3.7% from $481.8 million for the second quarter of 2011 and up 32.5% from $377.2 million for the third quarter of 2010. Total solar module shipments for the third quarter of 2011 were 355 MW, compared to total module shipments of 287 MW for the second quarter 2011 and 200 MW for the third quarter of 2010. Total solar module shipments for the third quarter of 2011 included 19.4 MW used in the Company's total solutions business.
By geography, in the third quarter of 2011, sales to European markets represented 61.7% of revenue, sales to North America represented 16.1% of revenue, and sales to Asia and others represented 22.2% of revenue, compared to 76.6%, 15.2% and 8.2%, respectively, in the second quarter of 2011 and 77.0%, 6.8% and 16.2%, respectively, in the third quarter of 2010.
Revenue by Geography | |||||||
Q3 2011 | Q2 2011 | Q3 2010 | |||||
US$M | % | US$M | % | US$M | % | ||
Europe | 308.2 | 61.7 | 369.1 | 76.6 | 290.3 | 77.0 | |
America | 80.6 | 16.1 | 73.0 | 15.2 | 25.6 | 6.8 | |
Asia and others | 110.8 | 22.2 | 39.7 | 8.2 | 61.3 | 16.2 | |
Total | 499.6 | 100.0 | 481.8 | 100.0 | 377.2 | 100.0 | |
Gross profit in the third quarter of 2011 was $11.9 million, compared to $63.7 million in the second quarter of 2011 and $65.3 million in the third quarter of 2010. Gross margin was 2.4% in the third quarter of 2011, compared to 13.2% in the second quarter of 2011 and 17.3% in the third quarter of 2010. The sequential and year-over-year declines in gross profit and gross margin were primarily due to lower average selling prices and approximately $36.1 million in non-cash inventory write-offs and non-cash loss on firm purchase commitment in the third quarter of 2011.
Total operating expenses were $42.6 million in the third quarter of 2011, compared to $38.7 million in the second quarter of 2011 and $25.3 million in the third quarter of 2010.
Selling expenses were $18.7 million in the third quarter of 2011, up 10.2% from the second quarter of 2011 and up 81.3% from the third quarter of 2010. The sequential and year-over-year increases in selling expenses were primarily due to increases in freight and other export-related expenses associated with higher shipment volumes.
General and administrative expenses were $16.0 million in the third quarter of 2011, compared to $16.8 million in the second quarter of 2011 and $13.7 million in the third quarter of 2010. The sequential decrease was primarily due to lower legal expenses and a partial reversal in taxes accrued in the second quarter of 2011, largely offset by increases in salaries and other expenses.
Research and development expenses were $7.9 million in the third quarter of 2011, compared to $4.9 million in the second quarter of 2011 and $1.3 million in the third quarter of 2010. The sequential and year-over-year increases were due to the Company's continued investment in advanced solar technologies, which are able to offer customers higher efficiency cells, and Commercial AC modules, among other innovative product initiatives.
Operating margin was negative 6.1% in the third quarter of 2011, compared to positive 5.2% in the second quarter of 2011 and positive 10.6% in the third quarter of 2010. The sequential and year-over-year decreases in operating margin were due to lower gross margin and higher operating expenses.
Interest expense in the third quarter of 2011 was $10.8 million, compared to $11.4 million in the second quarter of 2011 and $5.4 million in the third quarter of 2010. The sequential decrease in interest expense was primarily due to a decrease in bank borrowings during the third quarter of 2011. The year-over-year increase in interest expense was due to additional bank borrowings and higher interest rates. Interest income in the third quarter of 2011 was $3.0 million, compared to $2.2 million in the second quarter of 2011 and $2.5 million in the third quarter of 2010.
The Company recorded a gain on change in fair value of derivatives of $14.5 million in the third quarter of 2011, compared to a loss of $5.4 million in the second quarter of 2011 and a loss of $23.6 million in the third quarter of 2010. Foreign exchange loss in the third quarter of 2011 was $24.0 million, compared to a foreign exchange loss of $1.5 million in the second quarter of 2011 and foreign exchange gain of $11.9 million in the third quarter of 2010.
Income tax benefit in the third quarter of 2011 was $3.4 million, compared to income tax expense of $1.9 million in the second quarter of 2011 and income tax expense of $4.9 million in the third quarter of 2010. The third quarter income tax benefit reflects the truing up of the year-to-date effective tax rate to reflect the loss incurred during the quarter.
Net loss attributable to Canadian Solar in the third quarter of 2011 was $43.9 million, or $1.02 per diluted share, compared to net income of $7.1 million, or $0.16 per diluted share, in the second quarter 2011, and net income of $20.3 million, or $0.47 per diluted share, in the third quarter of 2010.
Financial Condition
As of September 30, 2011, the Company had $621.1 million in cash, cash equivalents and restricted cash, compared to $686.3 million as of June 30, 2011 and $476.2 million as of December 31, 2010. The sequential decline in cash, cash equivalents and restricted cash was due to a decrease in restricted cash, as the Company reduced its short-term borrowings.
Accounts receivable balance at the end of the third quarter of 2011 was $217.8 million, compared to $278.6 million at the end of the second quarter of 2011. The sequential decrease reflects the Company's pro-active receivables management efforts as well as an improved customer mix. Accounts receivable turnover days decreased to 47 days in the third quarter of 2011 from 56 days in the second quarter of 2011.
Inventories at the end of the third quarter of 2011 were $406.0 million, compared to $436.3 million at the end of the second quarter of 2011. Inventory turnover days were 85 days in the third quarter of 2011 compared to 84 days in the second quarter of 2011.
Accounts and notes payable were $407.1 million the end of the third quarter of 2011, compared to $304.9 million at the end of the second quarter of 2011. Accounts payable turnover days were 67 days in the third quarter of 2011 compared to 51 days in the second quarter of 2011. This increase was largely the result of the Company's efforts to work with its supply chain partners to more closely align payments with the current industry averages.
Short-term borrowings at the end of the third quarter of 2011 totaled $794.8 million compared to $912.4 million at the end of the second quarter of 2011. The Company relies on credit lines with several local banks for nearly all of its short-term borrowing needs. These credit lines are renewed every year and have no restrictive covenants attached to them. As of the date of this press release, the Company has approximately $763 million in unused credit facilities and historically has faced no difficulties renewing its credit lines. Long-term debt at the end of the third quarter 2011 was $153.6 million, compared to $183.3 million at the end of the second quarter of 2011. The Company's long-term debt was incurred in connection with our recent capacity expansion and has maturities ranging from 12 to 48 months.
As of September 30, 2011 the Company had $517.1 million in total stockholders' equity, compared to $559.7 million as of June 30, 2011 and $534.3 million as of December 31, 2010.
Dr. Shawn Qu, Chairman and Chief Executive Officer of Canadian Solar, remarked: "This was another challenging quarter as the solar industry continues to navigate pricing pressures, financing restrictions and fluctuating subsidies. I am proud that Canadian Solar's team remained focused despite the potential distractions. We met our shipment guidance for the quarter, reduced inventory levels and further improved our balance sheet. Customers continue to partner with Canadian Solar because of our global brand, strong track record of execution, the proven high-quality and performance of our modules, and our dedicated service. Based on our results, we believe that Canadian Solar is benefiting from the flight to quality and continues to gain market share."
Michael G. Potter, Senior Vice President and Chief Financial Officer of Canadian Solar, commented: "Our previous efforts to closely manage capacity and our flexible business model have positioned Canadian Solar with strong cash flow from operations despite the difficult current market environment. Unlike many other companies, Canadian Solar has adequate capacity - not overcapacity; and an inventory of high performance modules that customers want - not excess inventory of non-desired product. We will continue to evaluate and match resources to demand levels as we manage our cost structure. We are confident that, through continued strict management of our supply chain, inventory, operating costs and balance sheet, especially our working capital, Canadian Solar will emerge from this period in an even stronger financial and competitive position in the markets that we serve worldwide."
Business Outlook
The Company's business outlook is based on management's current views with respect to operating and market conditions, its current order book and customers' forecasts. Management's views and estimates are subject to change without notice.
For the fourth quarter of 2011, shipments are expected to be in the range of approximately 340 MW to 360 MW, with gross margin expected to be between 5% and 8%. Despite the challenging global financing environment, which continues to result in customer demand uncertainty, the Company reiterates its previous full year 2011 guidance of shipments of approximately 1.2 GW to 1.3 GW. The Company will continue to actively manage manufacturing utilization, inventory and mix levels, and operating expenses as demand levels fluctuate. The Company will also continue to explore ways to increase manufacturing efficiency and yield and to lower processing and consumable costs where opportunities exist.
Capital expenditures in the first nine months of 2011 totaled approximately $177 million. Reflecting the current demand environment, the Company will reduce capital expenditures in the fourth quarter 2011 to approximately $30 to $35 million, with the full year 2011 expected to be approximately $210 million, down approximately $90 million from prior plan.
Dr. Shawn Qu, Chairman and Chief Executive Officer of Canadian Solar, remarked: "We saw significant declines in raw materials costs in the third quarter of 2011, including lower costs for polysilicon, wafers and cells, which we expect to help lessen the impact of expected declines in module average selling prices. We are pursuing further internal cost reduction measures. On the module side, we expect to benefit from price declines in glass and other materials. We continue to believe that our long-term mid-teens target for gross margin on our module sales is achievable. We expect these actions to contribute to our efforts to maintain a reasonable margin structure towards 2012. Meanwhile, we are making steady progress on research and development, as well as new product launch initiatives. We have already started commercial shipments of our high-efficiency ELPS modules and expect these shipments to grow. We are also on track to expand our EPC and solar system kits business, which we expect to account for approximately 10% of our total MW sold in 2011 and to grow further in 2012. We expect our strong global sales and service network, our leading brand name and solid cash position, together with our technology innovations and diversified business strategy, to help drive our future success, as we focus on growing our way out of the industry downturn."
Recent Developments
On October 12, 2011, the Company launched its Intelligrated Power™ product series. Intelligrated Power integrates the intelligence of power electronics with specially-designed modules to deliver state-of-the-art features that maximize system performance, simplify installation and improve safety, significantly reducing cost of design and installation. The first product in the line, CommercialAC, integrates module and inverter into one high-performing module that dramatically simplifies commercial system design and installation. Beginning with CommercialAC, the complete Intelligrated Power product offering will eventually support all market segments. Canadian Solar unveiled the Intelligrated Power's CommercialAC at the Solar Power International 2011 Conference in Dallas, Texas on October 17-20, 2011.
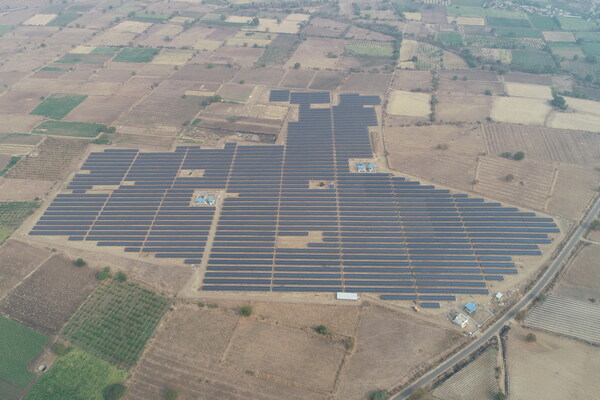
On October 4, 2011, the Company announced that it has supplied 636,000 solar modules for the world's largest solar complex in southern Brandenburg, Germany. Canadian Solar provided 148 MW of the project's total 166 MW. The system will be able to produce enough green energy for the usage needs of approximately 50,000 homes. The park was opened by Prime Minister Matthias Platzeck of Brandenburg on September 24.
On October 3, 2011, the Company announced that 22,000 of its high quality and high performance solar modules were used by its partner and EPC project supplier, Isolux Corsan, to build three 5 MW solar power plants in Langford, Churchtown and Manor based in Cornwall, England, for a total of 15 MW of installed capacity.
On September 23, 2011, the Company announced that it supplied solar modules to EOSOL Energies Nouvelles' new ground-mounted solar plant. Canadian Solar provided a total of 21,560 solar modules for an installed capacity of 5.1 MW. EOSOL Energies Nouvelles' new power plant called "Le Petit Chataignier" has been built in La Genetouze, in Southwest France, on an area of 89,300 m. The new solar power plant was inaugurated on September 22, 2011.
On September 21, 2011, the Company announced it has been awarded a contract to provide solar panels for a new 2.1 megawatt solar power installation at St. Peter's University Hospital in New Brunswick, New Jersey.
On September 20, 2011, the Company announced that it renewed its sponsorship agreement for the third year in a row with Virtus Pallacanestro Bologna, the Italian Lega A basketball team named "Canadian Solar Virtus Bologna".
On September 14, 2011, the Company announced the expansion of its U.S. operations with the opening of a second warehouse facility in Port Elizabeth, New Jersey to provide additional photovoltaic (PV) module storage capacity needed to support the Company's growing business.
On September 2, 2011, the Company announced that it supplied its high quality solar modules for Germany's largest solar power plant. Built by GP JOULE GmbH, the open-space solar power plant has a specified output of 70 MW located in the Southern Brandenburg region of Eastern Germany.
On September 1, 2011, at the 2011 EU PVSEC in Hamburg, the Company announced the official launch of its new solar modules incorporating the Company's ELPS (efficient, long-term photovoltaic solution) high-efficiency solar photovoltaic cell technology enabling cell conversion efficiencies of up to 19.5%.
On August 22, 2011, the Company announced a two-year partnership agreement with Fulham Football Club to become their official solar energy sponsor.
On August 19, 2011, the Company announced the official exclusive sponsorship of German top-league soccer teams Hannover 96 and 1. FC Nuremberg.
Conference Call Details
The Company will host a conference call on Tuesday, November 22, 2011 at 8:00 a.m. U.S. Eastern Time (9:00 p.m., November 22, 2011 in Hong Kong) to discuss the Company's financial results for the third quarter ended September 30, 2011. The dial-in phone number for the live audio call is +1-617-614-3472 or +1-800-706-7745, with passcode 67164051. A live webcast of the conference call will also be available on Canadian Solar's website at www.canadiansolar.com.
A replay of the call will be available approximately two hours after the conclusion of the live call through 10:00 a.m. on November 28, 2011, U.S. Eastern Time (11:00 p.m., November 28, 2011 in Hong Kong) by telephone at +1-617-801-6888, with passcode 35797115. A webcast replay will also be available at www.canadiansolar.com.
About Canadian Solar Inc. (NASDAQ: CSIQ)
Canadian Solar Inc. (NASDAQ: CSIQ) is one of the world's largest solar companies. As a leading vertically integrated provider of ingots, wafers, solar cells, solar modules and other solar applications, Canadian Solar designs, manufactures and delivers solar products and solar system solutions for on-grid and off-grid use to customers worldwide. With operations in North America, Europe, Australia and Asia, Canadian Solar provides premium quality, cost-effective and environmentally-friendly solar solutions to support global, sustainable development. For more information, please visit www.canadiansolar.com.
Safe Harbor/Forward-Looking Statements:
Certain statements in this press release including statements regarding our expected future shipment volumes, gross margins, supply cost, manufacturing capacities, and cell conversion efficiencies, are forward-looking statements that involve a number of risks and uncertainties that could cause actual results to differ materially. These statements are made under the "Safe Harbor" provisions of the U.S. Private Securities Litigation Reform Act of 1995. In some cases, you can identify forward-looking statements by such terms as "believes," "expects," "anticipates," "intends," "estimates," the negative of these terms, or other comparable terminology. Factors that could cause actual results to differ include the risks regarding the previously disclosed SEC investigation as well as general business and economic conditions and the state of the solar industry; governmental support for the deployment of solar power; future available supplies of high-purity silicon; demand for end-use products by consumers and inventory levels of such products in the supply chain; changes in demand from significant customers; changes in demand from major markets such as Germany; changes in customer order patterns; changes in product mix; capacity utilization; level of competition; pricing pressure and declines in average selling prices; delays in new product introduction; continued success in technological innovations and delivery of products with the features customers demand; shortage in supply of materials or capacity requirements; availability of financing; exchange rate fluctuations; litigation and other risks as described in the Company's SEC filings, including its annual report on Form 20-F filed on May 17, 2011. Although the Company believes that the expectations reflected in the forward looking statements are reasonable, it cannot guarantee future results, level of activity, performance, or achievements. You should not place undue reliance on these forward-looking statements. All information provided in this press release is as of today's date, unless otherwise stated, and Canadian Solar undertakes no duty to update such information, except as required under applicable law.
FINANCIAL TABLES FOLLOW
Canadian Solar Inc. | |||||||||
Unaudited Condensed Consolidated Statement of Operations | |||||||||
(In Thousands of US Dollars, except share and per share data) | |||||||||
Three Months Ended | Nine Months Ended | ||||||||
Item | 9-30-2011 | 6-30-2011 | 9-30-2010 | 9-30-2011 | 9-30-2010 | ||||
Net revenues | 499,639 | 481,820 | 377,183 | 1,424,863 | 1,042,789 | ||||
Cost of revenues | 487,735 | 418,145 | 311,907 | 1,283,964 | 890,994 | ||||
Gross profit | 11,904 | 63,675 | 65,276 | 140,899 | 151,795 | ||||
Selling expenses | 18,685 | 16,954 | 10,309 | 48,247 | 32,948 | ||||
General and administrative expenses | 16,037 | 16,814 | 13,734 | 49,474 | 35,865 | ||||
Research and development expenses | 7,885 | 4,894 | 1,256 | 14,827 | 4,779 | ||||
Total operating expenses | 42,607 | 38,662 | 25,299 | 112,548 | 73,592 | ||||
Income(Loss) from operations | (30,703) | 25,013 | 39,977 | 28,351 | 78,203 | ||||
Interest expenses | (10,795) | (11,421) | (5,381) | (32,107) | (15,689) | ||||
Interest income | 3,040 | 2,188 | 2,513 | 6,683 | 5,538 | ||||
Gain (Loss) on change in fair value of derivatives | 14,494 | (5,445) | (23,601) | (8,158) | (1,502) | ||||
Investment income (loss) | 309 | (217) | (99) | 91 | 58 | ||||
Exchange gain(loss) | (23,949) | (1,244) | 12,026 | (25,912) | (35,098) | ||||
Income(Loss) before taxes | (47,604) | 8,874 | 25,435 | (31,052) | 31,510 | ||||
Income tax expenses (benefit) | (3,379) | 1,907 | 4,893 | 271 | 6,467 | ||||
Net income(loss) | (44,225) | 6,967 | 20,542 | (31,323) | 25,043 | ||||
Less: Net income(loss) attributable to non-controlling interest | (348) | (115) | 225 | (405) | 11 | ||||
Net income(loss) attributable to CSI | (43,877) | 7,082 | 20,317 | (30,918) | 25,032 | ||||
Basic earnings(loss) per share | ($1.02) | $0.16 | $0.47 | ($0.72) | $0.58 | ||||
Basic weighted average outstanding shares | 43,154,552 | 43,084,112 | 42,870,102 | 43,049,773 | 42,822,584 | ||||
Diluted earnings(loss) per share | ($1.02) | $0.16 | $0.47 | ($0.72) | $0.57 | ||||
Diluted weighted average outstanding shares | 43,154,552 | 43,595,340 | 43,628,249 | 43,049,773 | 43,696,559 | ||||
Canadian Solar Inc. | |||||
Unaudited Condensed Consolidated Balance Sheet | |||||
(In Thousands of US Dollars) | |||||
September 30, 2011 | December 31, 2010 | ||||
Assets | |||||
Current assets | |||||
Cash and cash equivalents | 277,158 | 288,652 | |||
Restricted cash | 343,950 | 187,595 | |||
Accounts receivable, net of allowance for doubtful accounts | 217,832 | 169,657 | |||
Amount due from related parties | 18,599 | 1,356 | |||
Inventories | 405,959 | 272,097 | |||
Value added tax recoverable | 91,148 | 42,297 | |||
Advances to suppliers | 20,485 | 27,321 | |||
Foreign currency derivative assets | 5,074 | 2,183 | |||
Prepaid and other current assets | 125,572 | 43,508 | |||
Total current assets | 1,505,777 | 1,034,666 | |||
Property, plant and equipment, net | 486,115 | 330,460 | |||
Intangible assets | 10,458 | 2,695 | |||
Advances to suppliers | 12,320 | 13,946 | |||
Prepaid land use right | 13,721 | 13,378 | |||
Investments | 11,759 | 5,671 | |||
Deferred tax assets ———— non current | 24,341 | 16,725 | |||
Other non-current assets | 15,329 | 5,826 | |||
Total assets | 2,079,820 | 1,423,367 | |||
Current liabilities | |||||
Short term borrowings | 794,809 | 540,520 | |||
Accounts and notes payable | 407,069 | 123,373 | |||
Other payables | 66,018 | 47,876 | |||
Advances from customers | 23,965 | 8,971 | |||
Amounts due to related parties | 287 | 2,445 | |||
Foreign currency derivative liabilities | 309 | 2,452 | |||
Provision for firm purchase commitment | 36,970 | 15,889 | |||
Other current liabilities | 23,052 | 33,807 | |||
Total current liabilities | 1,352,479 | 775,333 | |||
Accrued warranty costs | 43,869 | 31,225 | |||
Liability for uncertain tax positions | 11,219 | 11,460 | |||
Convertible notes | 939 | 906 | |||
Long term borrowings | 153,590 | 69,458 | |||
Total liabilities | 1,562,096 | 888,382 | |||
Common shares | 502,403 | 501,146 | |||
Additional paid in capital | (54,400) | (57,392) | |||
Retained earnings | 31,193 | 62,111 | |||
Accumulated other comprehensive income | 37,866 | 28,462 | |||
Total Canadian Solar Inc. stockholders' equity | 517,062 | 534,327 | |||
Non-controlling interest | 662 | 658 | |||
Total equity | 517,724 | 534,985 | |||
Total liabilities and equity | 2,079,820 | 1,423,367 | |||