SHANGHAI, Nov. 10, 2010 / PRNewswire-Asia/ -- WuXi PharmaTech (Cayman) Inc. (NYSE: WX), a leading research and development outsourcing company serving the pharmaceutical, biotechnology, and medical device industries, with operations in China and the United States, today announced its financial results for third-quarter 2010.
Third-Quarter 2010 Highlights
Management Comment
"WuXi continued a strong 2010 with an excellent third quarter," said Dr. Ge Li, Chairman and Chief Executive Officer. "Total company revenues grew 20% year over year, and each of our businesses delivered strong revenue growth in the quarter. GAAP net income grew by 209% year over year, driven by this strong revenue growth and receipt of a $30 million termination fee relating to the proposed merger transaction with Charles River. Non-GAAP net income grew year over year by 27%. This strong performance leads us once again to increase our net revenue and operating income guidance for 2010.
"Strong trends for outsourcing of pharmaceutical discovery services are continuing," Dr. Li continued. "As the leading China-based pharmaceutical R&D services company, WuXi is well-positioned to benefit from these trends. We continue to make substantial progress in building a comprehensive platform of discovery and preclinical R&D services that any pharmaceutical or biotech company can use to discover and develop new drugs efficiently and cost-effectively.
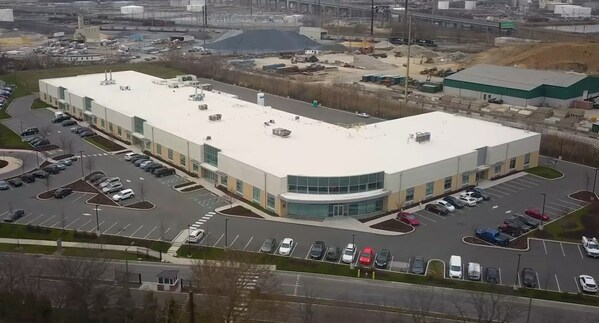
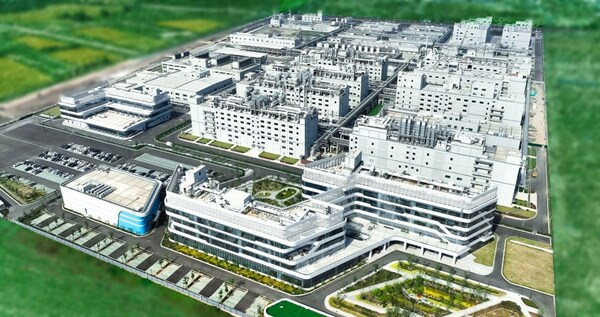
"As examples of that progress, we recently began operations in two newly built laboratories in Shanghai providing in-vivo pharmacology, DMPK, and discovery chemistry services. We made a decision to establish a new laboratory in the city of Wuhan that will house laboratory chemistry operations to tap into the talent pool and to leverage lower costs in central China. Our toxicology facility in Suzhou has been certified by both the OECD and the China State Food and Drug Administration to provide GLP general toxicology and genetic toxicity studies. We are also planning to build a pilot-scale GMP manufacturing facility in the city of WuXi to produce biological products for preclinical and clinical trials. We expect these expansion initiatives to drive continued revenue growth in future years," Dr. Li concluded.
GAAP Results
Third-quarter 2010 net revenues increased 20% year over year to $83.8 million due to 19% growth in Laboratory Services net revenues and 23% growth in Manufacturing Services net revenues. Laboratory Services net revenues in third-quarter 2010 benefited from stronger demand for our broad-based and integrated drug discovery and development services. Growth in Manufacturing Services net revenues reflected higher demand for pharmaceutical advanced intermediates and active ingredients.
Third-quarter 2010 GAAP gross profit increased 4% year over year to $29.8 million, mainly due to increased revenues, partially offset by increased expenses, including depreciation expense, relating to the large-scale manufacturing facility in Jinshan, the toxicology facility in Suzhou, and new pharmacology/DMPK/chemistry laboratories in Shanghai. Laboratory Services gross profit increased 4% year over year to $28.6 million and Manufacturing Services gross profit was essentially unchanged year over year at $1.2 million. In addition, third-quarter 2010 GAAP gross profit was reduced by $3.1 million in transaction-related bonuses paid to scientist employees after the termination of the Charles River transaction. These bonuses rewarded our employees' dedication to serving customers during the pendency of the previously proposed transaction. Third-quarter 2010 GAAP gross margin declined year over year to 35.6% from 41.1%, mainly due to these bonuses (3.7 percentage-point impact) and the increase in depreciation and other operating expenses of the large-scale manufacturing and toxicology facilities and the new pharmacology/DMPK/chemistry laboratories. The company expects the full-year 2010 GAAP gross margin to decline about 2 percentage points.
Third-quarter 2010 GAAP operating income increased 31% year over year to $19.2 million, mainly due to strong revenue growth and lower general and administrative expenses. Of the $30 million termination fee that we received from Charles River, $5 million was used to offset the merger-related costs in general and administrative expenses ($2.9 million was incurred and recorded in second-quarter 2010 and $2.0 million was incurred and recorded in third-quarter 2010). The remaining $25 million of the termination fee was recorded in other income, net. This increase in third-quarter 2010 GAAP operating income was partially offset by $3.7 million in bonuses paid to all employees after the termination of the Charles River transaction ($3.1 million paid to scientist employees and recorded in cost of revenues and $0.6 million paid to other employees and recorded in general and administrative expenses).
Third-quarter 2010 GAAP net income from continuing operations increased 205% year over year to $44.3 million due to the 31% increase in operating income, a $30 million termination fee related to the proposed transaction with Charles River Laboratories recorded in other income, net, and net gains on foreign-exchange forward contracts of $1.1 million versus $0.3 million in the prior-year quarter, partially offset by higher income tax expense driven by higher statutory tax rates in China.
Third-quarter 2010 GAAP net income grew 209% year over year to $44.3 million due to the 205% increase in net income from continuing operations and no losses from discontinued operations in the current quarter. Third-quarter 2009 GAAP net income included a loss from discontinued operations of $0.2 million related to write-off of certain obsolete assets of the biologics manufacturing business. Third-quarter 2010 GAAP diluted earnings per ADS grew 205% year over year to 59 cents, compared to 19 cents in third-quarter 2009, due primarily to the 209% increase in net income.
Non-GAAP Results
Non-GAAP financial results excluded the impact of share-based compensation expenses, amortization and the deferred tax impact of acquired intangible assets, the $30 million termination fee received from Charles River Laboratories related to previously proposed transaction, expenses incurred in connection with that transaction, bonuses paid to all employees after termination of the proposed transaction, and losses from discontinued operations.
Third-quarter 2010 non-GAAP gross profit increased 14% year over year to $34.5 million, mainly due to revenue growth in both the Laboratory Services and Manufacturing Services businesses, offset by increased expenses, including depreciation expense, relating to the large-scale manufacturing in Jinshan, the toxicology facility in Suzhou and new pharmacology/DMPK/chemistry laboratories in Shanghai. Third-quarter 2010 non-GAAP gross margin declined year over year to 41.2% from 43.2% due to increased expenses, including depreciation expense, relating to the large-scale manufacturing and toxicology facilities and new pharmacology/DMPK/chemistry laboratories. This decline in gross margins was consistent with the company's previous financial guidance.
Third-quarter 2010 non-GAAP operating income increased 26% year over year to $22.6 million, primarily due to the 14% increase in non-GAAP gross profit and restraint in spending for selling and marketing and general and administrative functions.
Third-quarter 2010 non-GAAP net income grew 27% year over year to $22.4 million due to the 26% increase in non-GAAP operating income and net gains on foreign-exchange forward contracts of $1.1 million versus $0.3 million in the prior-year quarter, partially offset by higher income tax expense driven by higher statutory tax rates in China. Diluted non-GAAP earnings per ADS from continuing operations grew 26% year over year to 30 cents compared to 24 cents in third-quarter 2009, mainly due to the 27% increase in non-GAAP net income.
(See the table titled Reconciliation of GAAP to Non-GAAP below)
2010 Financial Guidance Update
We update our full-year 2010 financial guidance as follows:
|
WUXI PHARMATECH (CAYMAN) INC. |
||||
|
UNAUDITED CONSOLIDATED BALANCE SHEETS |
||||
|
(in thousands of U.S. dollars, except ordinary share data) |
||||
|
September 30, 2010 |
December 31, 2009 |
|||
|
Assets: |
||||
|
Current assets: |
||||
|
Cash and cash equivalents |
100,537 |
80,510 |
||
|
Restricted cash |
1,675 |
1,358 |
||
|
Short-term investment |
52,445 |
22,083 |
||
|
Accounts receivable, net |
54,977 |
45,817 |
||
|
Inventories |
13,795 |
14,276 |
||
|
Prepaid expenses and other current assets |
13,710 |
10,125 |
||
|
Total current assets |
237,139 |
174,169 |
||
|
Non-current assets: |
||||
|
Goodwill |
23,956 |
23,956 |
||
|
Property, plant and equipment, net |
193,408 |
181,830 |
||
|
Intangible assets, net |
4,490 |
6,634 |
||
|
Prepaid land use rights |
5,319 |
5,308 |
||
|
Deferred tax assets |
8,867 |
9,514 |
||
|
Other non-current assets |
4,978 |
5,890 |
||
|
Total non-current assets |
241,018 |
233,132 |
||
|
Total assets |
478,157 |
407,301 |
||
|
Liabilities and equity: |
||||
|
Current liabilities: |
||||
|
Short-term and current portion of long-term debt |
6,260 |
34,415 |
||
|
Accounts payable |
16,065 |
14,356 |
||
|
Accrued expenses |
21,671 |
17,072 |
||
|
Deferred revenue |
7,192 |
4,554 |
||
|
Advanced subsidies |
2,630 |
2,800 |
||
|
Other taxes payable |
4,331 |
2,901 |
||
|
Other current liabilities |
6,609 |
4,239 |
||
|
Total current liabilities |
64,758 |
80,337 |
||
|
Non-current liabilities: |
||||
|
Long-term debt, excluding current portion |
1,919 |
2,115 |
||
|
Advanced subsidies |
1,288 |
1,420 |
||
|
Convertible notes |
35,864 |
35,864 |
||
|
Other non-current liabilities |
6,567 |
7,432 |
||
|
Total non-current liabilities |
45,638 |
46,831 |
||
|
Total liabilities |
110,396 |
127,168 |
||
|
Equity: |
||||
|
Ordinary shares ($0.02 par value, 5,002,550,000 authorized as of September 30, 2010 and December 31, 2009, respectively; 559,232,416 and 550,609,256 issued and outstanding as of September 30, 2010 and December 31, 2009, respectively) |
11,185 |
11,012 |
||
|
Additional paid-in capital |
329,193 |
320,672 |
||
|
Accumulated earnings (deficit) |
4,904 |
(68,631) |
||
|
Accumulated other comprehensive income |
22,479 |
17,080 |
||
|
Total equity |
367,761 |
280,133 |
||
|
Total liabilities and equity |
478,157 |
407,301 |
||
|
WUXI PHARMATECH (CAYMAN) INC. |
|||||||
|
UNAUDITED CONDENSED CONSOLIDATED STATEMENTS OF OPERATIONS |
|||||||
|
(In thousands of U.S. dollars, except ADS data and per ADS data) |
|||||||
|
Three Months Ended September 30, |
Nine Months Ended September 30, |
||||||
|
2010 |
2009 |
% Change |
2010 |
2009 |
% Change |
||
|
Net revenues: |
|||||||
|
Laboratory Services |
76,761 |
64,284 |
19% |
216,340 |
182,369 |
19% |
|
|
Manufacturing Services |
7,086 |
5,757 |
23% |
29,146 |
13,774 |
112% |
|
|
Total net revenues |
83,847 |
70,041 |
20% |
245,486 |
196,143 |
25% |
|
|
Cost of revenues: |
|||||||
|
Laboratory Services |
(48,152) |
(36,731) |
31% |
(128,608) |
(105,790) |
22% |
|
|
Manufacturing Services |
(5,865) |
(4,540) |
29% |
(23,423) |
(11,184) |
109% |
|
|
Total cost of revenues |
(54,017) |
(41,271) |
31% |
(152,031) |
(116,974) |
30% |
|
|
Gross profit: |
|||||||
|
Laboratory Services |
28,609 |
27,553 |
4% |
87,732 |
76,579 |
15% |
|
|
Manufacturing Services |
1,221 |
1,217 |
0% |
5,723 |
2,590 |
121% |
|
|
Total gross profit |
29,830 |
28,770 |
4% |
93,455 |
79,169 |
18% |
|
|
Operating expenses: |
|||||||
|
Selling and marketing expenses |
(2,140) |
(1,571) |
36% |
(6,754) |
(5,318) |
27% |
|
|
General and administrative expenses |
(8,484) |
(12,567) |
(32%) |
(33,970) |
(35,309) |
(4%) |
|
|
Total operating expenses |
(10,624) |
(14,138) |
(25%) |
(40,724) |
(40,627) |
0% |
|
|
Operating income |
19,206 |
14,632 |
31% |
52,731 |
38,542 |
37% |
|
|
Other income (expenses), net: |
|||||||
|
Other income, net |
26,802 |
861 |
* |
27,417 |
7,229 |
279% |
|
|
Interest income (expenses), net |
340 |
(139) |
* |
597 |
(45) |
* |
|
|
Total other income (expenses), net |
27,142 |
722 |
* |
28,014 |
7,184 |
290% |
|
|
Income from continuing operations before income taxes |
46,348 |
15,354 |
202% |
80,745 |
45,726 |
77% |
|
|
Income tax expenses |
(2,088) |
(853) |
145% |
(7,210) |
(4,805) |
50% |
|
|
Income from continuing operations |
44,260 |
14,501 |
205% |
73,535 |
40,921 |
80% |
|
|
Loss on discontinued operations, net (Note 1) |
|||||||
|
Loss from operations of discontinued component |
-- |
(313) |
* |
-- |
(313) |
* |
|
|
Income tax benefit |
-- |
139 |
* |
-- |
139 |
* |
|
|
Loss on discontinued operations |
-- |
(174) |
* |
-- |
(174) |
* |
|
|
Net income |
44,260 |
14,327 |
209% |
73,535 |
40,747 |
80% |
|
|
Basic net earnings (loss) per ADS: |
|||||||
|
Earnings from continuing operations |
$0.64 |
$0.21 |
199% |
$1.06 |
$0.60 |
75% |
|
|
Loss on discontinued operations—net of tax |
-- |
(0.00) |
* |
-- |
(0.00) |
* |
|
|
Net earnings per ADS |
$0.64 |
$0.21 |
203% |
$1.06 |
$0.60 |
76% |
|
|
Weighted average ADS outstanding—basic |
69,659,769 |
68,334,657 |
69,387,011 |
67,759,562 |
|||
|
Diluted net earnings (loss) per ADS: |
|||||||
|
Earnings from continuing operations |
$0.59 |
$0.19 |
201% |
$0.99 |
$0.55 |
77% |
|
|
Loss on discontinued operations—net of tax |
-- |
(0.00) |
* |
-- |
(0.00) |
* |
|
|
Net earnings per ADS |
$0.59 |
$0.19 |
205% |
$0.99 |
$0.55 |
78% |
|
|
Weighted average ADS outstanding—diluted |
74,583,839 |
73,529,129 |
74,586,316 |
73,439,494 |
|||
|
* Not meaningful |
|||||||
|
WUXI PHARMATECH (CAYMAN) INC. |
|||||||||||
|
RECONCILIATION OF GAAP TO NON-GAAP |
|||||||||||
|
(in thousands of U.S. dollars, except ADS data and per ADS data) |
|||||||||||
|
Three Months Ended September 30, |
Nine Months Ended September 30, |
||||||||||
|
2010 |
2009 |
% |
2010 |
2009 |
% |
||||||
|
GAAP gross profit—continuing operations |
29,830 |
28,770 |
4% |
93,455 |
79,169 |
18% |
|||||
|
GAAP gross margin—continuing operations |
36% |
41% |
38% |
40% |
|||||||
|
Adjustments: |
|||||||||||
|
Share-based compensation |
870 |
690 |
26% |
2,754 |
1,844 |
49% |
|||||
|
Amortization of acquired intangible assets |
764 |
764 |
0% |
2,292 |
2,292 |
0% |
|||||
|
Transaction-related employee bonuses |
3,076 |
-- |
* |
3,076 |
-- |
* |
|||||
|
Non-GAAP gross profit |
34,540 |
30,224 |
14% |
101,577 |
83,305 |
22% |
|||||
|
Non-GAAP gross margin |
41% |
43% |
41% |
42% |
|||||||
|
GAAP operating income—continuing operations |
19,206 |
14,632 |
31% |
52,731 |
38,542 |
37% |
|||||
|
GAAP operating margin—continuing operations |
23% |
21% |
21% |
20% |
|||||||
|
Adjustments: |
|||||||||||
|
Share-based compensation |
1,960 |
2,590 |
(24%) |
7,029 |
7,248 |
(3%) |
|||||
|
Transaction expenses |
1,977 |
-- |
* |
4,911 |
-- |
* |
|||||
|
Transaction-related employee bonuses |
3,721 |
-- |
* |
3,721 |
-- |
* |
|||||
|
Termination fee recorded to offset transaction expenses |
(5,000) |
-- |
* |
(5,000) |
-- |
* |
|||||
|
Amortization of acquired intangible assets |
764 |
764 |
0% |
2,292 |
2,292 |
0% |
|||||
|
Non-GAAP operating income |
22,628 |
17,986 |
26% |
65,684 |
48,082 |
37% |
|||||
|
Non-GAAP operating margin |
27% |
26% |
27% |
25% |
|||||||
|
GAAP net income—continuing operations |
44,260 |
14,501 |
205% |
73,535 |
40,921 |
80% |
|||||
|
GAAP net margin—continuing operations |
53% |
21% |
-- |
30% |
21% |
-- |
|||||
|
Adjustments: |
|||||||||||
|
Share-based compensation |
1,960 |
2,590 |
7,029 |
7,248 |
(3%) |
||||||
|
Transaction expenses |
1,977 |
-- |
* |
4,911 |
-- |
* |
|||||
|
Transaction-related employee bonuses |
3,721 |
-- |
* |
3,721 |
-- |
* |
|||||
|
Termination fee recorded to offset transaction expenses |
(5,000) |
-- |
* |
(5,000) |
-- |
* |
|||||
|
Termination fee recorded as other income, net |
(25,000) |
-- |
* |
(25,000) |
-- |
* |
|||||
|
Amortization of acquired intangible assets |
764 |
764 |
0% |
2,292 |
2,292 |
0% |
|||||
|
Deferred tax impact related to acquired intangible assets |
(296) |
(296) |
0% |
(888) |
(888) |
0% |
|||||
|
Non-GAAP net income |
22,386 |
17,559 |
27% |
60,600 |
49,573 |
22% |
|||||
|
Non-GAAP net margin |
27% |
25% |
25% |
25% |
|||||||
|
GAAP net income |
44,260 |
14,327 |
209% |
73,535 |
40,747 |
80% |
|||||
|
Add back: |
|||||||||||
|
Depreciation and amortization |
7,738 |
6,620 |
17% |
20,969 |
17,247 |
22% |
|||||
|
Interest (income) expenses, net |
(340) |
139 |
* |
(597) |
45 |
* |
|||||
|
Income tax expenses |
2,089 |
714 |
193% |
7,210 |
4,666 |
55% |
|||||
|
EBITDA |
53,747 |
21,800 |
147% |
101,117 |
62,705 |
61% |
|||||
|
Adjustments: |
|||||||||||
|
Share-based compensation |
1,960 |
2,590 |
(24%) |
7,029 |
7,248 |
(3%) |
|||||
|
Transaction expenses |
1,977 |
-- |
* |
4,911 |
-- |
* |
|||||
|
Transaction-related employee bonuses |
3,721 |
-- |
* |
3,721 |
-- |
* |
|||||
|
Termination fee recorded to offset transaction expenses |
(5,000) |
-- |
* |
(5,000) |
-- |
* |
|||||
|
Termination fee recorded as other income, net |
(25,000) |
-- |
* |
(25,000) |
-- |
* |
|||||
|
Impairment charge from discontinued operations |
33 |
||||||||||
|
Mark-to-market losses (gains) on foreign-exchange forward contracts |
(1,150) |
513 |
* |
(735) |
(1,706) |
(57%) |
|||||
|
Adjusted EBITDA |
30,255 |
24,903 |
21% |
86,076 |
68,247 |
26% |
|||||
|
Income attributable to holders of ADS (Non-GAAP): |
|||||||||||
|
Basic |
22,386 |
17,559 |
27% |
60,600 |
49,573 |
22% |
|||||
|
Diluted |
22,386 |
17,559 |
27% |
60,600 |
49,573 |
22% |
|||||
|
Basic earnings per ADS (Non-GAAP) |
0.32 |
0.26 |
25% |
0.87 |
0.73 |
19% |
|||||
|
Diluted earnings per ADS (Non-GAAP) |
0.30 |
0.24 |
26% |
0.81 |
0.68 |
20% |
|||||
|
Weighted average ADS outstanding – basic |
69,659,769 |
68,334,657 |
69,387,011 |
67,759,562 |
|||||||
|
Weighted average ADS outstanding – diluted |
74,583,839 |
73,529,129 |
74,586,316 |
73,439,494 |
|||||||
|
* Not meaningful |
|||||||||||
|
WUXI PHARMATECH (CAYMAN) INC. |
|||||||
|
REVENUE BREAKDOWN |
|||||||
|
(in thousands of U.S. dollars) |
|||||||
|
Three Months Ended September 30, |
Nine Months Ended September 30, |
||||||
|
2010 |
2009 |
% |
2010 |
2009 |
% |
||
|
Net revenues: |
|||||||
|
China-based Laboratory Services |
57,133 |
47,976 |
19% |
159,778 |
134,435 |
19% |
|
|
U.S.-based Laboratory Services |
19,628 |
16,308 |
20% |
56,562 |
47,934 |
18% |
|
|
Subtotal |
76,761 |
64,284 |
19% |
216,340 |
182,369 |
19% |
|
|
China-based Manufacturing Services |
7,086 |
5,757 |
23% |
29,146 |
13,774 |
112% |
|
|
Total net revenues |
83,847 |
70,041 |
20% |
245,486 |
196,143 |
25% |
|
Conference Call
WuXi PharmaTech senior management will host a conference call at 8:00 am (U.S. Eastern) / 5:00 am (U.S. Pacific) / 9:00 pm (Beijing/Shanghai/Hong Kong) on Wednesday, November 10, 2010, to discuss its third-quarter 2010 financial results and future prospects. The conference call may be accessed by calling:
|
United States: |
1-866-519-4004 |
|
|
China (Landline): |
800-819-0121 |
|
|
China (Mobile): |
400-620-8038 |
|
|
Hong Kong: |
800-930-346 |
|
|
United Kingdom: |
0-808-234-6646 |
|
|
International: |
+65-6723-9381 |
|
|
Conference ID: |
20164344 |
|
|
Web PIN: |
8656 |
|
A telephone replay will be available two hours after the call's completion at:
|
United States: |
1-866-214-5335 |
|
|
China North: |
10-800-714-0386 |
|
|
China South: |
10-800-140-0386 |
|
|
Hong Kong: |
800-901-596 |
|
|
United Kingdom: |
0-800-731-7846 |
|
|
International: |
+61-2-8235-5000 |
|
|
Conference ID: |
20164344 |
|
A live webcast of the conference call and replay will be available on the investor relations page of WuXi PharmaTech's website at http://www.wuxiapptec.com
About WuXi PharmaTech
WuXi PharmaTech is a leading pharmaceutical, biotechnology, and medical device R&D outsourcing company, with operations in China and the United States. As a research-driven and customer-focused company, WuXi PharmaTech provides broad and integrated portfolio of laboratory and manufacturing services throughout the drug and medical device R&D process. WuXi PharmaTech's services are designed to assist its global partners in shortening the cycle and lowering the cost of drug and medical device R&D. WuXi PharmaTech's operating subsidiaries are known as WuXi AppTec. For more information, please visit: http://www.wuxiapptec.com.
Use of Non-GAAP Financial Measures
We have provided three-month and nine-month 2009 and 2010 gross profit, gross margin, operating income, operating margin, net income and earnings per ADS on a non-GAAP basis, which excludes share-based compensation expenses, amortization and deferred tax impact of acquired intangible assets, transaction costs and termination fee relating to the terminated transaction with Charles River Laboratories, bonuses paid after the termination of the transaction, and losses from discontinued operations. We also provided three-month and nine-month 2009 and 2010 adjusted EBITDA, which is the GAAP net income adjusted by adding back depreciation and amortization, interest, income taxes, share-based compensation, mark-to-market gains (losses) from foreign-currency forward contracts, transaction costs and termination fee relating to the terminated transaction with Charles River Laboratories, bonuses paid after the termination of the transaction, and losses from discontinued operations. We believe both management and investors benefit from referring to these non-GAAP measures in assessing our financial performance and liquidity and when planning and forecasting future periods. These non-GAAP operating measures are useful for understanding and assessing underlying business performance and operating trends. We expect to continue providing gross profit, operating income, and net income on a non-GAAP basis using a consistent method on a quarterly basis.
You should not view non-GAAP results on a stand-alone basis or as a substitute for results under GAAP, or as being comparable to results reported or forecasted by other companies, and should refer to the reconciliation of non-GAAP measures to GAAP measures for the indicated periods attached hereto.
Cautionary Note Regarding Forward-Looking Statements
Statements in this release contain "forward-looking" statements within the meaning of Section 27A of the Securities Act of 1933, as amended, and Section 21E of the Securities Exchange Act of 1934, as amended, and as defined in the Private Securities Litigation Reform Act of 1995, including, among others, anticipated full-year and fourth-quarter 2010 operating results (including estimated total net revenues, China-based Laboratory Services net revenues, Manufacturing Services net revenues, adjusted EBITDA, gross margins, and other trends), the trend for outsourcing of pharmaceutical discovery services and our expansion initiatives to capitalize on that trend and drive revenue growth.
These forward-looking statements are not historical facts but instead represent only our belief regarding future events, many of which, by their nature, are inherently uncertain and outside of our control. Our actual results and financial condition and other circumstances may differ, possibly materially, from the anticipated results and financial condition indicated in these forward-looking statements. Among other factors, continued uncertainty in the global economy and the pressures being felt by our customers and pharmaceutical industry consolidation may adversely impact our business and the trends for outsourced R&D and manufacturing for longer than expected or more severely than expected; we may be unable to successfully make our planned investments, expansion initiatives and capital expenditures on a timely basis; these initiatives may not yield the desired results; we may need to modify the nature and level of our investments, initiatives and capital expenditures; pharmaceutical companies may not change their business models as expected or in a manner favorable to us; we may fail to capitalize on the opportunities presented; we may not maintain our preferred provider status with our clients; and we may be unable to successfully expand our capabilities to meet client needs. In addition, other factors that could cause our actual results to differ from what we currently anticipate include our limited operating history; failure to generate sufficient future cash flows or secure any required future financing on acceptable terms or at all; failure to retain key personnel; effective integration of continuing products and services from AppTec; our reliance on a limited number of customers to continue to account for a high percentage of our revenues; risk of payment failure by any of our large customers, which could significantly harm our cash flows and profitability; dependence upon the continued service of our senior management and key scientific personnel; and our ability to retain our existing customers or expand our customer base. You should read the financial information contained in this release in conjunction with the consolidated and pro-forma financial statements and related notes thereto included in our 2009 Annual Report on Form 20-F filed with and available on the Securities and Exchange Commission's website at http://www.sec.gov. For additional information on these and other important factors that could adversely affect our business, financial condition, results of operations and prospects, see "Risk Factors" beginning on page 6 of our 2009 Annual Report on Form 20-F. Our results of operations for third-quarter 2009 are not necessarily indicative of our operating results for any future periods. All projections in this release are based on limited information currently available to us, which is subject to change. Although these projections and the factors influencing them will likely change, we undertake no obligation to update or revise these forward-looking statements, whether as a result of new information, future events or otherwise, after the date of this press release, except as required by law. Such information speaks only as of the date of this release.