Continued Optimization of Product Portfolio and Focus on High Value-Added Applications
Q1 2022 Financial Highlights:
SHANGHAI, April 30, 2022 /PRNewswire/ -- Today, JCET (SSE: 600584), a leading global provider of integrated circuit (IC) manufacturing and technology services, announced its financial results for the first quarter of 2022. The financial report shows that the company had a positive start in 2022, achieving revenue of RMB 8.14 billion in the first quarter, up 21.2% year-on-year, and net profit of RMB 0.86 billion, both record high first quarter in the company's history.
As IC back-end manufacturing technology continues to develop in the direction of high density and low power consumption, various IC packaging solutions provide higher added value to the semiconductor industry. JCET managed well the market fluctuations and challenges by continuously optimizing its product portfolio and focusing on high value-added applications. JCET improved its market competitiveness, which was widely recognized and affirmed by customers.
JCET proactively took various preventive solutions and control measures to protect its employees' health and safety and maintain operation continuity under the current Covid-19 situation. In addition, JCET took corporate social responsibility actions and was involved deeply in local community anti-pandemic activities through charitable donations and other means. These activities contributed to our local communities and supported economic growth.
"The growth of demand for market innovation will drive the steady growth of IC back-end manufacturing market in the coming years," said Mr. Li Zheng, Chief Executive Officer of JCET. "JCET is focusing on high value-added market application areas such as automotive electronics, power devices, and high-performance computing. This will expand our technology advantages and mass production competitive advantages that we accumulated over the years in the fields of high-density wire bond package, system-in-package, wafer level packaging, high-reliability discrete devices, etc. We strive to overcome the market fluctuations and supply chain uncertainties under the current Covid-19 pandemic situation. JCET will continue to provide high-quality production and technology services to our customers." Mr. Li Zheng added "JCET announced the implementation of an equity incentive plan for employees for the first time in the company's 19 years of history. The plan will drive sustainable growth, secure shareholders' interests, and motivate our employees. With the strong support from our customers, shareholders, and partners, we have a high sense of responsibility and strong confidence for the company's future development."
For more information, please refer to the JCET Q1 FY2022 report.
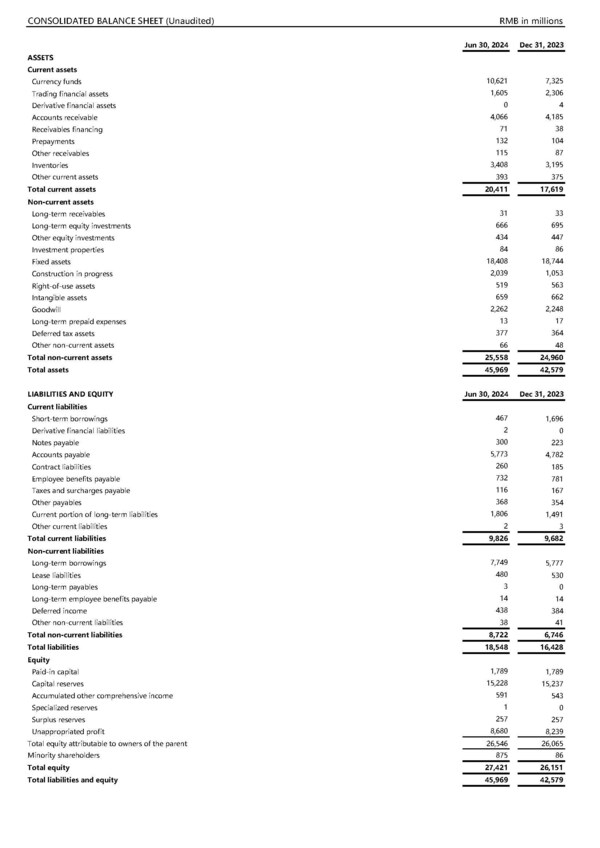
CONSOLIDATED BALANCE SHEET (Unaudited) |
RMB in millions |
||||||||
Mar 31, 2022 |
Dec 31, 2021 |
||||||||
ASSETS |
|||||||||
Current assets |
|||||||||
Currency funds |
2,512 |
2,761 |
|||||||
Trading financial assets |
3,290 |
2,670 |
|||||||
Derivative financial assets |
2 |
5 |
|||||||
Accounts receivable |
3,945 |
4,271 |
|||||||
Receivables financing |
36 |
28 |
|||||||
Prepayments |
242 |
183 |
|||||||
Other receivables |
77 |
77 |
|||||||
Inventories |
3,264 |
3,193 |
|||||||
Assets classified as held for sale |
0 |
99 |
|||||||
Other current assets |
84 |
130 |
|||||||
Total current assets |
13,452 |
13,417 |
|||||||
Non-current assets |
|||||||||
Long-term receivables |
37 |
38 |
|||||||
Long-term equity investments |
765 |
770 |
|||||||
Other equity investments |
448 |
418 |
|||||||
Investment properties |
92 |
93 |
|||||||
Fixed assets |
18,297 |
18,424 |
|||||||
Construction in progress |
574 |
661 |
|||||||
Right-of-use assets |
588 |
622 |
|||||||
Intangible assets |
432 |
447 |
|||||||
Goodwill |
2,014 |
2,023 |
|||||||
Deferred tax assets |
187 |
185 |
|||||||
Other non-current assets |
1 |
1 |
|||||||
Total non-current assets |
23,435 |
23,682 |
|||||||
Total assets |
36,887 |
37,099 |
|||||||
LIABILITIES AND EQUITY |
Mar 31, 2022 |
Dec 31, 2021 |
|||||||
Current liabilities |
|||||||||
Short-term borrowings |
1,633 |
2,193 |
|||||||
Derivative financial liabilities |
6 |
2 |
|||||||
Notes payable |
527 |
579 |
|||||||
Accounts payable |
4,893 |
5,298 |
|||||||
Contract liabilities |
453 |
458 |
|||||||
Employee benefits payable |
872 |
1,062 |
|||||||
Taxes and surcharges payable |
273 |
235 |
|||||||
Other payables |
375 |
414 |
|||||||
Liabilities classified as held for sale |
0 |
45 |
|||||||
Current portion of long-term liabilities |
1,256 |
1,052 |
|||||||
Other current liabilities |
3 |
3 |
|||||||
Total current liabilities |
10,291 |
11,341 |
|||||||
Non-current liabilities |
|||||||||
Long-term borrowings |
3,791 |
3,751 |
|||||||
Bonds payable |
0 |
0 |
|||||||
Lease liabilities |
528 |
568 |
|||||||
Long-term payables |
0 |
0 |
|||||||
Long-term employee benefits payable |
19 |
20 |
|||||||
Deferred income |
338 |
337 |
|||||||
Deferred tax liabilities |
99 |
82 |
|||||||
Total non-current liabilities |
4,775 |
4,758 |
|||||||
Total liabilities |
15,066 |
16,099 |
|||||||
Equity |
|||||||||
Paid-in capital |
1,780 |
1,780 |
|||||||
Capital reserves |
14,986 |
14,984 |
|||||||
Accumulated other comprehensive income |
(314) |
(281) |
|||||||
Surplus reserves |
174 |
174 |
|||||||
Unappropriated profit |
5,195 |
4,334 |
|||||||
Total equity attributable to owners of the parent |
21,821 |
20,991 |
|||||||
Minority shareholders |
0 |
9 |
|||||||
Total equity |
21,821 |
21,000 |
|||||||
Total liabilities and equity |
36,887 |
37,099 |
|||||||
CONSOLIDATED INCOME STATEMENT (Unaudited) |
RMB in millions, except share data |
||||||||
Three months ended |
|||||||||
Mar 31, 2022 |
Mar 31, 2021 |
||||||||
Revenue |
8,138 |
6,712 |
|||||||
Less: Cost of sales |
6,599 |
5,636 |
|||||||
Taxes and surcharges |
16 |
20 |
|||||||
Selling expenses |
49 |
49 |
|||||||
Administrative expenses |
258 |
230 |
|||||||
Research and development expenses |
322 |
258 |
|||||||
Finance expenses |
23 |
96 |
|||||||
Including: Interest expenses |
43 |
110 |
|||||||
Interest income |
7 |
5 |
|||||||
Add: Other income |
56 |
41 |
|||||||
Investment income / (loss) |
12 |
(2) |
|||||||
Including: Income / (loss) from investments in associates and joint ventures |
(5) |
(2) |
|||||||
Gain / (loss) on the net position hedging |
0 |
(2) |
|||||||
Gain / (loss) on changes in fair value of financial assets/liabilities |
3 |
0 |
|||||||
Credit impairment (loss is expressed by "-") |
(7) |
4 |
|||||||
Asset impairment (loss is expressed by "-") |
1 |
(28) |
|||||||
Gain / (loss) on disposal of assets |
15 |
6 |
|||||||
Operating profit / (loss) |
951 |
442 |
|||||||
Add: Non-operating income |
5 |
0 |
|||||||
Less: Non-operating expenses |
0 |
2 |
|||||||
Profit / (loss) before income taxes |
956 |
440 |
|||||||
Less: Income tax expenses |
95 |
53 |
|||||||
Net profit / (loss) |
861 |
387 |
|||||||
Classified by continuity of operations |
|||||||||
Profit / (loss) from continuing operations |
861 |
387 |
|||||||
Classified by ownership |
|||||||||
Net profit / (loss) attributable to owners of the parent |
861 |
386 |
|||||||
Net profit / (loss) attributable to minority shareholders |
0 |
1 |
|||||||
Add: Unappropriated profit at beginning of period |
4,334 |
1,518 |
|||||||
Unappropriated profit at end of period (attributable to owners of the parent) |
5,195 |
1,904 |
|||||||
Other comprehensive income, net of tax |
(32) |
47 |
|||||||
Comprehensive income attributable to owners of the parent |
(32) |
47 |
|||||||
Comprehensive income not be reclassified to profit or loss |
0 |
1 |
|||||||
Remeasurement gains or losses of a defined benefit plan |
0 |
1 |
|||||||
Comprehensive income to be reclassified to profit or loss |
(32) |
46 |
|||||||
Cash flow hedge reserve |
(4) |
(10) |
|||||||
Exchange differences of foreign currency financial statements |
(28) |
56 |
|||||||
Total comprehensive income |
829 |
434 |
|||||||
Including: |
|||||||||
Total comprehensive income attributable to owners of the parent |
829 |
433 |
|||||||
Total comprehensive income attributable to minority shareholders |
0 |
1 |
|||||||
Earnings per share |
|||||||||
Basic earnings per share |
0.48 |
0.24 |
|||||||
Diluted earnings per share |
0.48 |
0.24 |
|||||||
CONSOLIDATED CASH FLOW STATEMENT (Unaudited) |
RMB in millions |
||||||||
Three months ended |
|||||||||
Mar 31, 2022 |
Mar 31, 2021 |
||||||||
CASH FLOWS FROM OPERATING ACTIVITIES |
|||||||||
Cash receipts from the sale of goods and the rendering of services |
8,815 |
7,439 |
|||||||
Receipts of taxes and surcharges refunds |
115 |
157 |
|||||||
Other cash receipts relating to operating activities |
70 |
51 |
|||||||
Total cash inflows from operating activities |
9,000 |
7,647 |
|||||||
Cash payments for goods and services |
5,845 |
5,073 |
|||||||
Cash payments to and on behalf of employees |
1,249 |
1,128 |
|||||||
Payments of all types of taxes and surcharges |
187 |
130 |
|||||||
Other cash payments relating to operating activities |
79 |
112 |
|||||||
Total cash outflows from operating activities |
7,360 |
6,443 |
|||||||
Net cash flows from operating activities |
1,640 |
1,204 |
|||||||
CASH FLOWS FROM INVESTING ACTIVITIES |
|||||||||
Cash receipts from returns of investments |
1,000 |
0 |
|||||||
Cash receipts from investment income |
6 |
0 |
|||||||
Net cash receipts from disposal of fixed assets, intangible assets and other long-term assets |
26 |
36 |
|||||||
Net cash receipts from disposal of subsidiaries and other business units |
28 |
0 |
|||||||
Total cash inflows from investing activities |
1,060 |
36 |
|||||||
Cash payments to acquire fixed assets, intangible assets and other long-term assets |
899 |
597 |
|||||||
Cash payments for investments |
1,650 |
0 |
|||||||
Total cash outflows from investing activities |
2,549 |
597 |
|||||||
Net cash flows from investing activities |
(1,489) |
(561) |
|||||||
CASH FLOWS FROM FINANCING ACTIVITIES |
|||||||||
Cash receipts from borrowings |
531 |
1,623 |
|||||||
Other cash receipts relating to financing activities |
0 |
347 |
|||||||
Total cash inflows from financing activities |
531 |
1,970 |
|||||||
Cash repayments for debts |
746 |
2,662 |
|||||||
Cash payments for distribution of dividends or profit and interest expenses |
42 |
134 |
|||||||
Other cash payments relating to financing activities |
143 |
107 |
|||||||
Total cash outflows from financing activities |
931 |
2,903 |
|||||||
Net cash flows from financing activities |
(400) |
(933) |
|||||||
EFFECT OF EXCHANGE RATE CHANGES ON CASH AND CASH EQUIVALENTS |
(2) |
7 |
|||||||
NET INCREASE IN CASH AND CASH EQUIVALENTS |
(251) |
(283) |
|||||||
Add: Cash and cash equivalents at beginning of period |
2,763 |
2,167 |
|||||||
CASH AND CASH EQUIVALENTS AT END OF PERIOD |
2,512 |
1,884 |
|||||||
![]() View original content to download multimedia:https://www.prnewswire.com/news-releases/jcet-continues-solid-growth-momentum-in-q1-2022-301536440.html
View original content to download multimedia:https://www.prnewswire.com/news-releases/jcet-continues-solid-growth-momentum-in-q1-2022-301536440.html