Strong demand for advanced technology drives growth (Q2 2020 Financial Highlights):
SHANGHAI, Aug. 20, 2020 /PRNewswire/ -- Global leading semiconductor microsystem integration packaging and test provider, JCET Group (SH: 600584) reported financial results for the second quarter 2020, ended June 30th, 2020. Revenue was RMB 6.27 billion and net profit was RMB 0.23 billion, both a record second quarter high in the past five years. These results show that JCET's investment in the development of advanced packaging and test technologies has begun to bear fruit.
Mr. Li Zheng, Chief Executive Officer of JCET Group, said, "Following our strong Q1 with this Q2 performance shows that JCET is benefiting from the strengths of our three global manufacturing hubs, and the continuous improvement of our operational excellence. The rapid development of the 5G communications industry and high-performance computing applications has increased the demand for advanced packaging technologies and manufacturing processes. JCET Group's global supply chain resources and strong portfolio of advanced technology combined with our world-class management team will continue to provide our global customers with industry-leading semiconductor packaging, test and design services."
Ms. Janet Chou, Chief Financial Officer of JCET Group, said, "JCET delivered solid second quarter results with improvement in key financial metrics. Our performance demonstrated our commitment to drive profitable growth and cash generation."
About JCET Group:
JCET Group is a leading global semiconductor system integration packaging and test provider, offering a full range of turnkey services that include semiconductor package integration design and characterization, R&D, wafer probe, wafer bumping, package assembly, final test and drop shipment to vendors around the world.
Our comprehensive portfolio covers a wide spectrum of semiconductor applications such as mobile, communication, compute, consumer, automotive and industry etc., through advanced wafer level packaging, 2.5D/3D, System-in-Packaging, and reliable flip chip and wire bonding technologies. JCET Group has two R&D centers in China and Korea, six manufacturing locations in China, Korea and Singapore, and sales centers around the world, providing close technology collaboration and efficient supply-chain manufacturing to customers in China and around the world.
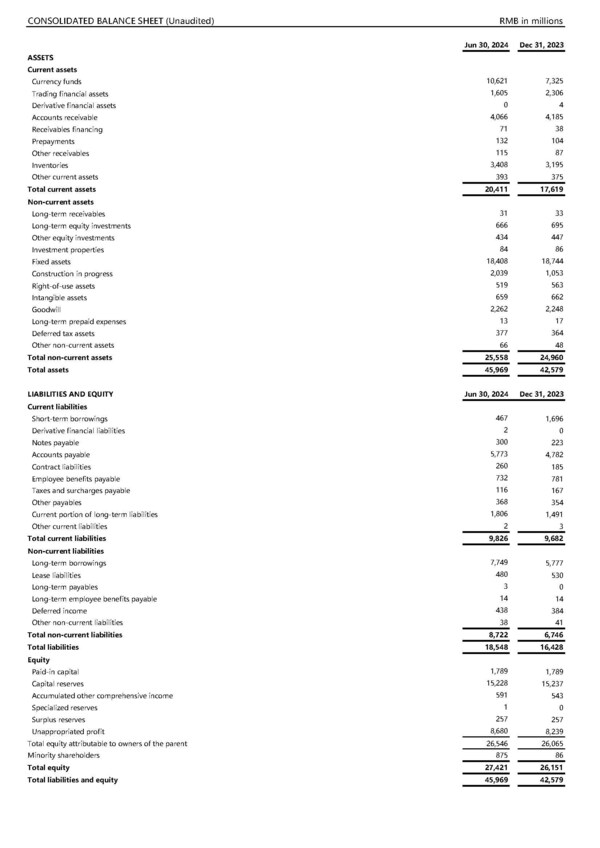
CONSOLIDATED BALANCE SHEET (Unaudited) |
RMB in millions |
||||||||
As of |
|||||||||
ASSETS |
Jun 30, 2020 |
Dec 31, 2019 |
|||||||
Current assets |
|||||||||
Currency funds |
2,813 |
2,569 |
|||||||
Derivative financial assets |
3 |
4 |
|||||||
Accounts receivable |
2,958 |
3,350 |
|||||||
Receivables financing |
59 |
68 |
|||||||
Prepayments |
214 |
188 |
|||||||
Other receivables |
12 |
11 |
|||||||
Inventories |
2,663 |
2,731 |
|||||||
Current portion of non-current assets |
137 |
137 |
|||||||
Other current assets |
186 |
501 |
|||||||
Total current assets |
9,045 |
9,559 |
|||||||
Non-current assets |
|||||||||
Long-term receivables |
31 |
40 |
|||||||
Long-term equity investments |
986 |
972 |
|||||||
Other equity investments |
527 |
517 |
|||||||
Investment properties |
98 |
100 |
|||||||
Fixed assets |
18,130 |
17,799 |
|||||||
Construction in progress |
1,146 |
1,664 |
|||||||
Intangible assets |
560 |
587 |
|||||||
Goodwill |
2,248 |
2,214 |
|||||||
Long-term prepaid expenses |
0 |
1 |
|||||||
Deferred tax assets |
121 |
128 |
|||||||
Other non-current assets |
1 |
1 |
|||||||
Total non-current assets |
23,848 |
24,023 |
|||||||
Total assets |
32,893 |
33,582 |
|||||||
CONSOLIDATED BALANCE SHEET (CONTINUED) (Unaudited) |
RMB in millions |
||||||||
As of |
|||||||||
LIABILITIES AND EQUITY |
Jun 30, 2020 |
Dec 31, 2019 |
|||||||
Current liabilities |
|||||||||
Short-term borrowings |
6,127 |
9,098 |
|||||||
Derivative financial liabilities |
101 |
161 |
|||||||
Notes payable |
589 |
958 |
|||||||
Accounts payable |
3,788 |
4,618 |
|||||||
Receipts in advance |
0 |
113 |
|||||||
Contract liabilities |
38 |
0 |
|||||||
Employee benefits payable |
588 |
586 |
|||||||
Taxes and surcharges payable |
93 |
53 |
|||||||
Other payables |
210 |
235 |
|||||||
Current portion of long term liabilities |
2,590 |
1,827 |
|||||||
Total current liabilities |
14,124 |
17,649 |
|||||||
Non-current liabilities |
|||||||||
Long-term borrowings |
3,185 |
1,585 |
|||||||
Bonds payable |
1,012 |
0 |
|||||||
Long-term payables |
920 |
1,216 |
|||||||
Long-term employee benefits payable |
1 |
1 |
|||||||
Deferred income |
332 |
337 |
|||||||
Deferred tax liabilities |
159 |
156 |
|||||||
Total non-current liabilities |
5,609 |
3,295 |
|||||||
Total liabilities |
19,733 |
20,944 |
|||||||
Equity |
|||||||||
Paid-in capital |
1,603 |
1,603 |
|||||||
Surplus reserves |
10,242 |
10,242 |
|||||||
Accumulated other comprehensive income |
586 |
429 |
|||||||
Specialized reserves |
122 |
122 |
|||||||
Unappropriated profit |
598 |
231 |
|||||||
Total equity attributable to owners of the parent |
13,151 |
12,627 |
|||||||
Minority shareholders |
9 |
11 |
|||||||
Total equity |
13,160 |
12,638 |
|||||||
Total liabilities and equity |
32,893 |
33,582 |
|||||||
CONSOLIDATED INCOME STATEMENT(Unaudited) |
RMB in millions, except share data |
|||||||
Three months ended |
Six months ended |
|||||||
Jun 30, 2020 |
Jun 30, 2019 |
Jun 30, 2020 |
Jun 30, 2019 |
|||||
Revenue |
6,268 |
4,634 |
11,976 |
9,149 |
||||
Less: Cost of sales |
5,271 |
4,149 |
10,232 |
8,298 |
||||
Taxes and surcharges |
9 |
9 |
17 |
17 |
||||
Selling expenses |
59 |
63 |
116 |
128 |
||||
Administrative expenses |
226 |
303 |
435 |
549 |
||||
Research and development expenses |
276 |
176 |
491 |
349 |
||||
Finance expenses |
156 |
186 |
303 |
434 |
||||
Including: Interest expenses |
149 |
171 |
303 |
368 |
||||
Interest income |
10 |
5 |
19 |
12 |
||||
Add: Other income |
46 |
41 |
80 |
185 |
||||
Investment income/(loss) |
(6) |
(2) |
(7) |
(3) |
||||
Including: Income/(loss) from investments in |
(6) |
(2) |
(7) |
(3) |
||||
Gain/(loss) on the net position hedging |
(4) |
0 |
(5) |
0 |
||||
Credit impairment (loss is expressed by"-") |
(11) |
(9) |
(6) |
(8) |
||||
Asset impairment (loss is expressed by"-") |
(28) |
(17) |
(25) |
(14) |
||||
Gain/(loss) on disposal of assets |
5 |
7 |
9 |
7 |
||||
Operating profit/(loss) |
273 |
(232) |
428 |
(459) |
||||
Add: Non-operating income |
0 |
0 |
0 |
1 |
||||
Less: Non-operating expenses |
2 |
0 |
8 |
4 |
||||
Profit/(loss) before income taxes |
271 |
(232) |
420 |
(462) |
||||
Less: Income tax expenses |
38 |
(20) |
53 |
(204) |
||||
Net profit/(loss) |
233 |
(212) |
367 |
(258) |
||||
Classified by continuity of operations |
||||||||
Profit/(loss) from continuing operations |
233 |
(212) |
367 |
(258) |
||||
Classified by ownership |
||||||||
Net profit/(loss) attributable to owners of the parent |
232 |
(212) |
366 |
(259) |
||||
Net profit/(loss) attributable to minority shareholders |
1 |
0 |
1 |
1 |
||||
CONSOLIDATED INCOME STATEMENT (CONTINUED) (Unaudited) |
RMB in millions, except share data |
||||||||
Three months ended |
Six months ended |
||||||||
Jun 30, 2020 |
Jun 30, 2019 |
Jun 30, 2020 |
Jun 30, 2019 |
||||||
Other comprehensive income, net of tax |
27 |
170 |
157 |
(42) |
|||||
Comprehensive income attributable to owners of the |
27 |
170 |
157 |
(42) |
|||||
Comprehensive income to be reclassified to profit or loss |
27 |
170 |
157 |
(42) |
|||||
Comprehensive income using the equity method |
0 |
0 |
0 |
0 |
|||||
Cash flow hedge reserve |
5 |
2 |
3 |
5 |
|||||
Exchange differences of foreign currency financial |
22 |
168 |
154 |
(47) |
|||||
Total comprehensive income |
260 |
(42) |
524 |
(300) |
|||||
Including: |
|||||||||
Total comprehensive income attributable to owners of |
259 |
(42) |
524 |
(301) |
|||||
Total comprehensive income attributable to minority |
1 |
0 |
0 |
1 |
|||||
Earnings per share |
|||||||||
Basic earnings per share |
0.15 |
(0.13) |
0.23 |
(0.16) |
|||||
Diluted earnings per share |
0.15 |
(0.13) |
0.23 |
(0.16) |
|||||
CONSOLIDATED CASH FLOW STATEMENT (Unaudited) |
RMB in millions |
||||||||
Three months ended |
Six months ended |
||||||||
Jun 30, 2020 |
Jun 30, 2019 |
Jun 30, 2020 |
Jun 30, 2019 |
||||||
CASH FLOWS FROM OPERATING ACTIVITIES |
|||||||||
Cash receipts from the sale of goods and the rendering of |
6,857 |
4,547 |
12,892 |
9,956 |
|||||
Receipts of taxes and surcharges refunds |
200 |
74 |
423 |
158 |
|||||
Other cash receipts relating to operating activities |
230 |
41 |
523 |
208 |
|||||
Total cash inflows from operating activities |
7,287 |
4,662 |
13,838 |
10,322 |
|||||
Cash payments for goods and services |
5,117 |
2,901 |
9,342 |
7,176 |
|||||
Cash payments to and on behalf of employees |
829 |
826 |
1,788 |
1,788 |
|||||
Payments of all types of taxes and surcharges |
142 |
119 |
232 |
238 |
|||||
Other cash payments relating to operating activities |
195 |
168 |
323 |
303 |
|||||
Total cash outflows from operating activities |
6,283 |
4,014 |
11,685 |
9,505 |
|||||
Net cash flows from operating activities |
1,004 |
648 |
2,153 |
817 |
|||||
CASH FLOWS FROM INVESTING ACTIVITIES |
|||||||||
Cash receipts from returns of investments |
0 |
50 |
0 |
66 |
|||||
Cash receipts from investment income |
0 |
(24) |
0 |
0 |
|||||
Net cash receipts from disposal of fixed assets, intangible |
20 |
9 |
27 |
15 |
|||||
Other cash receipts relating to investing activities |
0 |
0 |
0 |
20 |
|||||
Total cash inflows from investing activities |
20 |
35 |
27 |
101 |
|||||
Cash payments to acquire fixed assets, intangible assets and |
659 |
940 |
1,337 |
1,530 |
|||||
Total cash outflows from investing activities |
659 |
940 |
1,337 |
1,530 |
|||||
Net cash flows from investing activities |
(639) |
(905) |
(1,310) |
(1,429) |
|||||
CONSOLIDATED CASH FLOW STATEMENT (CONTINUED) (Unaudited) |
RMB in millions |
||||||||
Three months ended |
Six months ended |
||||||||
Jun 30, 2020 |
Jun 30, 2019 |
Jun 30, 2020 |
Jun 30, 2019 |
||||||
CASH FLOWS FROM FINANCING ACTIVITIES |
|||||||||
Cash receipts from borrowings |
2,601 |
2,632 |
8,531 |
8,494 |
|||||
Other cash receipts relating to financing activities |
0 |
777 |
0 |
777 |
|||||
Total cash inflows from financing activities |
2,601 |
3,409 |
8,531 |
9,271 |
|||||
Cash repayments for debts |
2,393 |
2,379 |
8,141 |
9,206 |
|||||
Cash payments for distribution of dividends or profit and |
141 |
136 |
305 |
437 |
|||||
Other cash payments relating to financing activities |
111 |
284 |
285 |
717 |
|||||
Total cash outflows from financing activities |
2,645 |
2,799 |
8,731 |
10,360 |
|||||
Net cash flows from financing activities |
(44) |
610 |
(200) |
(1,089) |
|||||
EFFECT OF EXCHANGE RATE CHANGES ON CASH AND |
(7) |
26 |
16 |
6 |
|||||
NET INCREASE IN CASH AND CASH EQUIVALENTS |
314 |
379 |
659 |
(1,695) |
|||||
Add: Cash and cash equivalents at beginning of the year |
2,211 |
2,132 |
1,866 |
4,206 |
|||||
CASH AND CASH EQUIVALENTS AT END OF THE PERIOD |
2,525 |
2,511 |
2,525 |
2,511 |
|||||