BETHESDA, Md., Feb. 8 /PRNewswire-Asia/ -- Chindex International, Inc. (Nasdaq: CHDX), a leading independent American provider of Western healthcare products and services in the People's Republic of China, today announced financial results for the third quarter and first nine months of fiscal year 2010.
Financial Highlights:
-- Revenue in the third quarter of fiscal year 2010 increased 12% year
over year to $46.5 million;
-- Net income for the third quarter of fiscal 2010 increased to $3.9
million, or $0.24 per diluted share, from $846,000, or $0.05 per
diluted share in the prior year period;
-- The Company received a refund of $3.3 million for business tax paid
since January 1, 2009 in the Healthcare Services division, equivalent
to approximately $0.15 per diluted share;
-- Revenue in the first nine months of 2009 increased 16.2% year over year
to $129.9 million;
-- Net income for the first nine months of 2009 increased to $7.7 million,
or $0.48 per diluted share, from $1.5 million, or $0.10 per diluted
share in the prior year period.
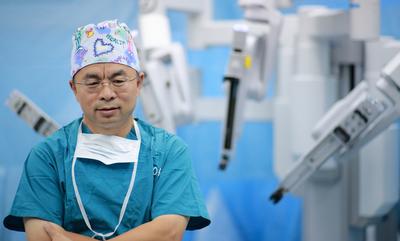
Roberta Lipson, President and CEO of Chindex, commented, "We are pleased with our profitability and year to date performance which reflect substantial improvements over last year. In the Healthcare Services division we are in a development cycle with operations in the Beijing market experiencing capacity limitations as we build out the expansion facilities. At the same time, operations in the Shanghai and Guangzhou markets continue along expected growth trajectories. The Medical Products division is always subject to quarterly fluctuations, and although we are seeing significant improvements over last year, we are experiencing regulatory delays on high-value medical equipment purchases. Nevertheless, there continues to be significant excitement in the marketplace for our products, particularly for the daVinci surgical robot and the new S/SC 2000 ultrasound platform. As we enter the fourth quarter, and look forward into our next fiscal year, we remain extremely well-positioned to capitalize on China's premium-quality healthcare services market, continued economic vibrancy and opportunities created by healthcare reform."
Revenue in the third quarter of fiscal year 2010 increased 12% to $46.5 million from $41.6 million in the third quarter of fiscal year 2009. Revenue from the Healthcare Services division increased 5% to $21.6 million from $20.5 million in the third quarter of fiscal year 2009, and reflected growing inpatient and outpatient volume offset by disruption due to construction of the expanded facility in Beijing. The Company expects the negative impact of the expansion work to continue through the opening of the expanded facilities, currently planned for the fall of 2010. Revenue from the Medical Products division increased 18% to $24.9 million from $21.1 million in the prior year period, reflecting the increase in sales of women's health imaging products and the delivery of two robotic surgical systems. During this quarter, the Company also recorded revenues of approximately $3.2 million under its current KfW Development Bank contracts.
During the quarter, the Company recorded income from operations of $6.6 million, compared to income from operations of $1.9 million in the same quarter last year. Income from operations includes the benefit of a $3.3 million business tax refund related to the Healthcare Services division. This tax refund is equivalent to approximately $0.15 per diluted share. Total operating costs and expenses for the third quarter of fiscal year 2010 were flat on a year over year basis and included $269,000 of development and startup expenses for new clinics, equivalent to $0.02 per diluted share, and non-cash stock compensation expense of $888,000, or $0.05 per diluted share. In the prior period, the Company's development and startup expense were $662,000, or $0.04 per diluted share, and non-cash stock compensation expense was $810,000, or $0.05 per diluted share.
The Company recorded a $2.7 million provision for taxes, or an effective tax rate of 41.1%, in the third quarter of fiscal year 2010 as compared to a provision for taxes of $658,000, or an effective tax rate of 43.7%, in the prior year period. The tax rate reflects losses in entities for which the Company cannot yet recognize a benefit.
Net income for the quarter ended December 31, 2009 was $3.9 million, or $0.24 per diluted share. Excluding the tax refund explained above, net income for the third quarter of fiscal year 2010 would be $1,497,000, or $0.09 per diluted share. This compares to net income of $846,000, or $0.05 per diluted share, in the prior year period.
Healthcare Services division business results:
For the third quarter of fiscal year 2010, revenue increased 5% to $21.6 million from $20.5 million for the prior year quarter. The increase reflected growing inpatient and outpatient volume offset by disruption due to construction of the expanded facility in Beijing.
Excluding the $3.3 million tax benefit discussed above, operating costs increased by 5% to $19.3 million, and income from operations before foreign exchange gains increased to $5.6 million from $2.1 million in the prior year period.
Lipson continued, "We were pleased to see our revenue increase sequentially and on a year over year basis despite the temporary disruption at our BJU facility, which should more than double our capacity by calendar year-end. We were also particularly excited to receive a $3.3 million business tax rebate and receive a business tax exemption going forward. We believe this treatment from authorities in the for-profit hospital sector, is evidence that healthcare reform efforts in China will continue to drive growth throughout the sector and further enhance our position as the leading, private sector provider in the premium-care market."
Medical Products division business results:
For the third quarter of fiscal year 2010, revenue increased 18% to $24.9 million from $21.1 million in the prior year quarter. Revenue performance mainly reflected increases in sales of women's health imaging products and delivery of two robotic surgical systems.
Revenue performance year to date also reflects continued delays in the order cycle for high value capital medical equipment, particularly for robotic surgical systems, resulting from the Chinese government's review of these technologies as well as the overall timing of the tender process in China. Sales excluding daVinci were lower than the prior year period, reflecting the introduction of a new generation of technology in diagnostic ultrasound which replaced the previous market leading product. During this quarter, the Company also recorded revenues of approximately $3.2 million under its current KfW Development Bank contracts.
Gross profit for the Medical Products division increased to $7.3 million from $5.6 million in the prior year's third quarter, representing an increase in gross profit margin to 29% from 26% in the year over year period. The variance in gross profit margin is in line with historical averages.
Lipson concluded, "The government's review of high value technologies used in public hospitals is a routine process impacting new, big ticket medical products. We believe that the review itself substantiates the continued demand we see for premium medical technology in China, and bodes well for future sales across our portfolio despite causing disruptions to daVinci sales this quarter."
Fiscal 2010 Third Quarter Conference Call
Management will host a conference call today at 8:00 am ET to discuss financial results.
To participate in the conference call, international callers should dial 1-719-325-4757 and domestic callers should dial 1-877-874-1568 approximately 10 minutes before the conference call is scheduled to begin.
The telephone replay will be available on the day of the call at (international) 1-719-457-0820 and (domestic) 1-888-203-1112 and continue to be available through February 22, 2010.
This call is also being webcast and will be accessible at Chindex's website http://ir.chindex.com/events.cfm . The event will be archived and available for replay through February 22, 2010.
About Chindex International, Inc.
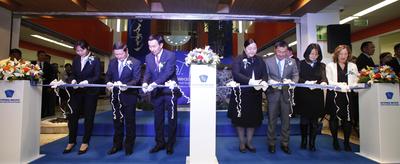
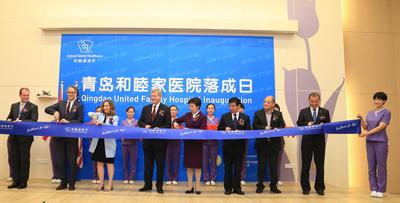
Chindex is an American healthcare company that provides healthcare services and supplies medical capital equipment, instrumentation and products to the Chinese marketplace, including Hong Kong. Healthcare services are provided through the operations of its United Family Hospitals and Clinics, a network of private primary care hospitals and affiliated ambulatory clinics in China. The Company's hospital network currently operates in the Beijing, Shanghai, Guangzhou and Wuxi. The Company sells medical products manufactured by various major multinational companies, including Siemens AG and Intuitive Surgical, for which the Company is the exclusive distribution partner for the sale and servicing of color ultrasound systems and surgical robotic systems respectively. It also arranges financing packages for the supply of medical products to hospitals in China utilizing the export loan and loan guarantee programs of both the U.S. Export-Import Bank and the German KfW Development Bank. With twenty-seven years of experience, approximately 1,300 employees, and operations in China, Hong Kong, the United States and Germany, the Company's strategy is to expand its cross-cultural reach by providing leading edge healthcare technologies, quality products and services to Greater China's professional communities. Further company information may be found at the Company's websites http://www.chindex.com and http://www.unitedfamilyhospitals.com .
Safe Harbor Statement
Statements made in this press release relating to plans, strategies, objectives, economic performance and trends and other statements that are not descriptions of historical facts may be forward-looking statements within the meaning of Section 27A of the Securities Act of 1933, as amended (the "Securities Act"), and Section 21E of the Securities Exchange Act of 1934, as amended (the "Exchange Act"). Forward-looking information is inherently subject to risks and uncertainties, and actual results could differ materially from those currently anticipated due to a number of factors, which include, but are not limited to, the factors set forth under the heading "Risk Factors" in our annual report on Form 10-K for the year ended March 31, 2009, updates and additions to those "Risk Factors" in our interim reports on Form 10-Q, Forms 8-K and in other documents filed by us with the Securities and Exchange Commission from time to time. Forward-looking statements may be identified by terms such as "may," "will," "should," "could," "expects," "plans," "intends," "anticipates," "believes," "estimates," "predicts," "forecasts," "potential," or "continue" or similar terms or the negative of these terms. Although we believe that the expectations reflected in the forward-looking statements are reasonable, we cannot guarantee future results, levels of activity, performance or achievements. We have no obligation to update these forward-looking statements.
Financial Summary Attached
CHINDEX INTERNATIONAL, INC.
CONSOLIDATED CONDENSED STATEMENTS OF OPERATIONS
(in thousands except share and per share data)
(Unaudited)
Three months ended Nine months ended
December 31, December 31,
2009 2008 2009 2008
Product sales $24,921 $21,070 $65,324 $52,607
Healthcare services
revenue 21,563 20,530 64,610 59,171
Total revenue 46,484 41,600 129,934 111,778
Cost and expenses
Product sales costs 17,652 15,493 47,506 38,576
Healthcare services
costs 14,699 17,185 48,801 49,586
Selling and marketing
expenses 3,841 3,867 10,609 9,590
General and
administrative
expenses 3,699 3,158 9,740 9,728
Income from operations 6,593 1,897 13,278 4,298
Other (expenses) and
income
Interest expense (230) (259) (784) (738)
Interest income 477 527 1,350 1,316
Miscellaneous
(expense) income -
net (220) (661) (851) (1,257)
Income before income
taxes 6,620 1,504 12,993 3,619
Provision for income
taxes (2,722) (658) (5,304) (2,073)
Net income $3,898 $846 $7,689 $1,546
Net income per common
share - basic $.27 $.06 $.53 $.11
Weighted average shares
outstanding - basic 14,592,992 14,455,237 14,533,601 14,395,239
Net income per common
share - diluted $.24 $.05 $.48 $.10
Weighted average
shares outstanding
- diluted 16,211,607 15,836,521 16,127,180 16,089,705
CHINDEX INTERNATIONAL, INC.
CONSOLIDATED CONDENSED BALANCE SHEETS
(in thousands except share data)
(Unaudited)
December 31, March 31,
2009 2009
ASSETS
Current assets:
Cash and cash equivalents $23,760 $20,293
Restricted cash 450 1,854
Investments 57,672 51,502
Accounts receivable, less allowance for
doubtful accounts of $5,661 and $5,041,
respectively
Product sales receivables 30,608 37,994
Patient service receivables 9,699 8,837
Inventories, net 13,444 11,346
Deferred income taxes 3,255 2,410
Other current assets 3,329 3,239
Total current assets 142,217 137,475
Restricted cash 2,402 1,437
Investments 322 --
Property and equipment, net 21,386 20,633
Noncurrent deferred income taxes 29 1,031
Other assets 2,923 2,061
Total assets $169,279 $162,637
LIABILITIES AND STOCKHOLDERS' EQUITY
Current liabilities:
Short-term debt, current portion of long-term
debt and vendor financing $2,613 $1,631
Current portion of capitalized leases -- 22
Accounts payable 10,366 12,259
Accrued expenses 14,577 20,607
Other current liabilities 6,660 4,148
Deferred revenue 2,394 1,539
Income taxes payable 2,939 1,568
Total current liabilities 39,549 41,774
Long-term debt, vendor financing and
convertible debentures 21,578 23,709
Long-term deferred revenue 1,151 595
Long-term deferred tax liability 119 119
Total liabilities 62,397 66,197
Commitments and contingencies
Stockholders' equity:
Preferred stock, $.01 par value, 500,000
shares authorized, none issued -- --
Common stock, $.01 par value, 28,200,000
shares authorized, including
3,200,000 designated Class B:
Common stock - 13,717,768 and
13,452,007 shares issued and
outstanding at December 31, 2009
and March 31, 2009, respectively 137 135
Class B stock - 1,162,500 shares issued
and outstanding at December 31,
2009 and March 31, 2009, respectively 12 12
Additional paid-in capital 98,728 95,808
Accumulated other comprehensive income 3,044 3,072
Retained earnings (accumulated deficit) 4,961 (2,587)
Total stockholders' equity 106,882 96,440
Total liabilities and
stockholders' equity $169,279 $162,637
CHINDEX INTERNATIONAL, INC.
SEGMENT INFORMATION
The Company operates in two businesses: Healthcare Services and Medical Products. The Company evaluates performance and allocates resources based on profit or loss from operations before income taxes, not including foreign exchange gains or losses. The following segment information has been provided per Statement of Financial Accounting Standards No. 131, "Disclosures about Segments of an Enterprise and Related Information:" (in thousands except percentages)
Healthcare Medical
Services Products Total
For the three months ended
December 31, 2009:
Sales and service revenue $21,563 $24,921 $46,484
Gross Profit n/a * 7,269 n/a
Gross Profit % n/a * 29% n/a
Income from operations before
foreign exchange $5,637 $1,265 $6,902
Foreign exchange loss (309)
Income from operations $6,593
Other income, net 27
Income before income taxes $6,620
Assets as of December 31, 2009 $106,242 $63,037 $169,279
Healthcare Medical
Services Products Total
For the three months ended
December 31, 2008:
Sales and service revenue $20,530 $21,070 $41,600
Gross Profit n/a * 5,577 n/a
Gross Profit % n/a * 26% n/a
Income (loss) from operations
before foreign exchange $2,142 $(630) $1,512
Foreign exchange gain 385
Income from operations $1,897
Other (expense), net (393)
Income before income taxes $1,504
Assets as of March 31, 2009 $94,675 $67,962 $162,637
Healthcare Medical
Services Products Total
For the nine months ended
December 31, 2009:
Sales and service revenue $64,610 $65,324 $129,934
Gross Profit n/a * 17,818 n/a
Gross Profit % n/a * 27% n/a
Income from operations before
foreign exchange $12,043 $25 $12,068
Foreign exchange gain 1,210
Income from operations $13,278
Other (expense), net (285)
Income before income taxes $12,993
Assets as of December 31, 2009 $106,242 $63,037 $169,279
Healthcare Medical
Services Products Total
For the nine months ended
December 31, 2008:
Sales and service revenue $59,171 $52,607 $111,778
Gross Profit n/a * 14,031 n/a
Gross Profit % n/a * 27% n/a
Income (loss) from operations
before foreign exchange $5,970 $(2,185) $3,785
Foreign exchange gain 513
Income from operations $4,298
Other (expense), net (679)
Income before income taxes $3,619
Assets as of March 31, 2009 $94,675 $67,962 $162,637
* Gross profit margins are not routinely calculated in the healthcare
service industry.
For more information, please contact:
Integrated Corporate Relations
Ashley M. Ammon
Tel: +1-646-277-1227