Fiscal Year 2007 Financial Highlights
-- Total revenues were $65.4 million, an increase of 62% compared to $40.4
million in 2006
-- Operating profit was $23.7 million, up 69% year-over-year
-- Gross profit margin increased to 49.6% from 48.6% in 2006
-- Net income was $16.9 million, down 8% from $18.4 million in 2006 which
benefited from a one-time non-cash income of approximately $6.4 million
-- Diluted earnings per share were $0.91 for 2007, compared to $1.01 for
2006. Excluding the non-cash charge related to the amortization
expense of the debt discount and the effect of the accounting
adjustment on the fair value of the warrants, diluted earnings per
share would have increased 55% to $1.15 for 2007 compared to $0.74 for
2006
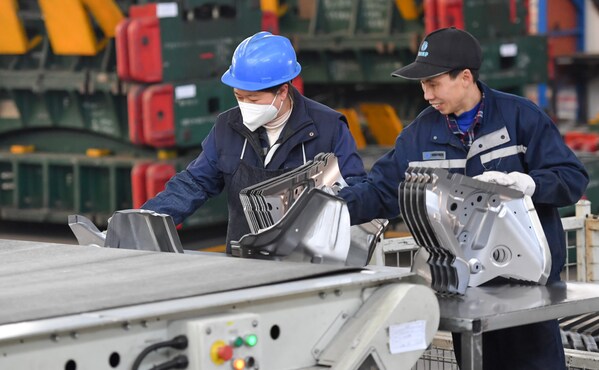
HARBIN, China, March 12 /Xinhua-PRNewswire-FirstCall/ -- Harbin Electric, Inc., (or the “Company”, Nasdaq: HRBN), a market leader in customized linear motors, motor/controller automation systems, automobile specialty micro-motors, and other special motors, announced its financial results and filed its 10-KSB on March 10, 2008 for the fiscal year ended December 31, 2007.
Financial Highlights for 2007
2007 2006 YoY%
Change
Revenue $65,402,864 $40,415,777 62%
Gross Profit $32,434,977 $19,661,495 65%
Gross Profit
Margin 49.6% 48.6%
Operating Income $23,711,292 $13,994,235 69%
Operating Margin 36.3% 34.6%
Net Income $16,902,684 $18,438,512 (8%)
Net Profit Margin 25.8% 45.6%
Diluted EPS $0.91 $1.01 (10%)
Tianfu Yang, Harbin Electric Chairman and Chief Executive Officer commented, “We are very happy with our financial performance in 2007 which built on the momentum from 2006. We believe that our solid year-over-year growth demonstrates the successful execution of the business strategy that we have laid out for the Company. Particularly, our proprietary technology and product development capability helped gross profit margin increase to 49.6% in 2007, in our view, a remarkable achievement given that gross margin very rarely exceeds 45% in our industry. We believe that this further demonstrates our unique and strong competitive position in the market place. Our successful acquisition and integration of the automobile specialty
micro-motors business was, in our view, a key factor in our growth. Although this business only contributed to our second half of the year results, it already accounted for approximately 16% of total revenues for the entire year. Sales of our core linear motor business including our new Tower Type Oil Pump also expanded alongside the growth in sales to our existing customers. Direct sales of our products to markets outside China also increased significantly.”
Revenues
For the 2007 fiscal year, revenues increased by $25.0 million or 62% to $65.4 million from $40.4 million in 2006. Linear motors and related integrated application systems generated 56% of our revenues, automobile specialty micro-motors generated 16% of our revenues, and controllers, armatures, and other special motors generated 28% of our revenues compared to 67%, 0%, and 33% respectively in 2006.
The sixty-two percent year-over-year increase in revenues was primarily driven by increased sales from existing customers and from the acquisition of Harbin Taifu Auto Electric Co., Ltd., a manufacturer of automobile specialty micro-motors that the Company acquired in July 2007. Revenues from the acquired automobile specialty micro-motors business contributed approximately $10.5 million to total revenues, representing 42% of the total revenue growth. The remaining 58% of total revenue growth came from increased purchases by existing customers of linear motor, armature and micro-motor products, and the new Tower Type Oil Pump which was launched in early 2007. The Company delivered 13 units of the Tower Type Oil Pump in 2007.
The Company’s products that were sold directly to markets outside China increased to 12.4% of total sales in 2007 from 3.1% in 2006, reflecting the rapid growth of the Company’s international business.
Gross Profit
The Company reported a gross profit of $32.4 million in 2007 compared to $19.7 million in 2006, representing a 65% year-over-year increase primarily driven by higher sales volume and improved product mix. The overall gross profit margin, as a percentage of revenue, was 49.6% in 2007 compared to 48.6% in 2006. The increase in gross profit margin was largely driven by growth in the sales of higher margin linear motors including the Tower Type Oil Pump. By segment, the gross profit margin was 52% for linear motors, and 44% for automobile specialty micro-motors. Gross profit margin for the Tower Type Oil Pump product was 53%. Changes in raw materials prices did not have a material impact on gross margins in either 2007 or 2006.
Operating Income
The Company achieved a 69% year-over-year growth in operating profit, to $23.7 million in 2007 from $14.0 million in 2006. The significant growth in operating profit was primarily attributable to the overall growth in sales. Operating margin for 2007 was 36.3%, up from 34.6% in 2006, reflecting what we believe to be our improved operating efficiency and better diversified product mix.
Selling, general and administrative expense was $7.7 million, or 11.7% of sales, in 2007, compared to $4.2 million, or 10.3% of sales, in 2006. The year-over-year increase in SG&A was primarily due to higher shipping, sales and marketing, and administrative costs as a result of volume growth and increased sales activity. Additionally, higher consulting, auditing, legal and administrative expenses associated with the Company’s listing on NASDAQ in January 2007 contributed significantly to the increase in SG&A costs.
However, as a percentage of total sales, the Company’s total operating expenses declined to 13.3% in 2007 from 14.0% in 2006, reflecting the Company’s success in controlling cost and improved efficiency derived from the substantial year-over-year revenue growth.
Net Income
Net Income for 2007 was $16.9 million ($0.91 per diluted share) compared to $18.4 million ($1.01 per diluted share) for 2006 which included a one-time non-cash income of approximately $6.4 million as a result of an accounting adjustment in the fair value of the warrants due to a change in accounting principle. This accounting adjustment increased net earnings by $0.35 per diluted share in 2006.
Excluding the accounting adjustment, net income increased 40% to $16.9 million in 2007 ($0.91 per diluted share) from $12.1 million in 2006 ($0.66 per diluted share). This increase in net income was mainly due to sales to new customers, new products, and increased sales to existing customers, especially sales of automobile specialty micro-motors and Tower Type Oil Pump products.
Additionally, the non-cash amortization expense related to the debt discount on the $50 million notes issued on August 30, 2006 amounted to approximately $4.5 million in 2007 compared to about $1.5 million in 2006. This non-operating charge reduced annual net earnings by $0.24 per diluted share in 2007 compared to only $0.08 per diluted share in 2006. As of December 31, 2007, the unamortized debt discount totaled approximately $16.9 million.
Diluted earnings per share were $0.91 for 2007, compared to $1.01 for 2006. Excluding the non-cash charge related to the amortization expense of the debt discount and the effect of the accounting adjustment on the fair value of the warrants, diluted earnings per share would have increased 55% to $1.15 for 2007 compared to $0.74 for 2006.
The Company’s total diluted share count at the end of 2007 was 18,634,739 compared to 18,306,569 at the end of 2006. The increase was mainly driven by an increase in options and warrants exercised in 2007.
Financial Results for the Quarter Ended December 31, 2007
For the quarter ended December 31, 2007, total revenue increased 61% to $19.3 million compared to $12.0 million reported for 4Q2006. This growth was largely attributable to the automobile specialty micro-motors business that the Company acquired in July 2007. Sales of the new Tower Type Oil Pump also contributed to revenue growth.
Gross profit increased 61% to $9.3 million in 4Q2007 compared to $5.8 million in the same period of 2006. Gross profit margin remained stable at 48.2% in both periods.
Operating income totaled $6.0 million in 4Q2007, representing a 36% growth from $4.4 million in 4Q2006. Operating margin for the quarter ended December 31, 2007 declined to 31.0% from 36.7% in 4Q2006. The decline was primarily attributed to higher SG&A for 4Q2007 compared to 4Q2006.
Looking ahead, Mr. Yang commented, “As we move into 2008, we expect continued sales growth from our automobile specialty micro-motors business, our core linear motors business including Tower Type Oil Pumps, and from others including armatures, controllers, and other specialty motors. In 2008, we expect to increase the production of automobile specialty micro-motors and begin shipping some of the new products we developed to new customers, particularly as our new manufacturing facility in Shanghai becomes operational. We also have several new products under development in the automobile segment and expect to bring them to market in 2008. While we delivered 13 Tower Type Oil Pump units in 2007, we expect a dramatic increase to more than 200 units in 2008. Finally, we are continuing the joint development of the linear motor driven train system for urban mass transportation with the Institute of Electrical Engineering of the Chinese Academy of Sciences (“IEECAS”) and expect that this product could begin to contribute to our business in 2009, assuming a successful test run at the end of 2008.”
Mr. Yang concluded, “We believe that we have laid a solid foundation for business growth and made notable progress in the past several years as we strengthened R&D capabilities, broadened product offerings, improved manufacturing processes and efficiencies, and strengthened our management team. We expect that we will fully capitalize on all these investments over the next few years to maximize shareholder value.”
About Harbin Electric, Inc.
Harbin Electric, headquartered in Harbin, China, is a market leader in linear motors, motor/controller automation systems, automobile specialty micro-motors, and other special motors. It is the first and currently, to our knowledge, the only Chinese company to provide product development and integrated production tailored to customer applications in this industry. The Company takes pride in its environmental and social policies. The Company believes that it provides customers with energy efficient products and its employees with a family-friendly working environment, based on competitive compensation and humane work schedules.
A strong focus of Harbin Electric is its emphasis on technology, innovation and creativity, based on a strong research and development (R&D) capability. It recruits talent worldwide and through collaboration with top scientific institutions. Its ISO certified manufacturing facility is equipped with state-of-the-art production lines and quality control systems to ensure product quality.
China’s rapidly expanding economy and government policy supporting the industry have provided a strong growth platform for Harbin Electric. To learn more about Harbin Electric, visit http://www.harbinelectric.com .
(Financial tables to follow)
HARBIN ELECTRIC, INC. AND SUBSIDIARIES
CONSOLIDATED BALANCE SHEETS
FOR THE YEARS ENDED DECEMBER 31, 2007 AND 2006
A S S E T S
2007 2006
CURRENT ASSETS:
Cash $45,533,893 $67,313,919
Accounts receivable, net of
allowance for doubtful accounts of
$116,238 and $44,552 as of December 31,
2007 and 2006, respectively 23,216,543 8,827,799
Inventories 2,570,929 583,287
Other receivables 326,639 148,243
Other receivables - related parties -- 44,998
Advances on inventory purchases 1,772,204 834,590
Total current assets 73,420,208 77,752,836
PLANT AND EQUIPMENT, net 23,858,035 9,219,534
OTHER ASSETS:
Debt issue costs, net of
amortization 2,214,717 2,757,155
Advances on equipment purchases 24,328,386 --
Advances on intangible assets 1,384,710 1,487,120
Intangible assets, net of
accumulated amortization 5,899,989 640,337
Other assets 397,263 1,101,839
Cross currency hedge receivable 145,945 --
Deposit in derivative hedge 1,000,000 --
Total other assets 35,371,010 5,986,451
Total assets $132,649,253 $92,958,821
L I A B I L I T I E S A N D
S H A R E H O L D E R S’ E Q U I T Y
CURRENT LIABILITIES:
Accounts payable $263,314 $258,911
Other payables 1,380,119 406,520
Other payables - related party 45,491 --
Accrued liabilities 83,099 107,263
Customer deposits 333,253 319,261
Taxes payable 839,299 556,943
Interest payable 1,122,000 1,122,000
Total current liabilities 4,066,575 2,770,898
NOTES PAYABLE, net of debt discount
$16,878,269 and $21,410,401 as of
December 31, 2007 and 2006, respectively 33,121,731 28,589,599
FAIR VALUE OF DERIVATIVE INSTRUMENT 10,844,372 --
WARRANT LIABILITIES -- 16,568,080
Total liabilities 48,032,678 47,928,577
COMMITMENTS AND CONTINGENCIES -- --
SHAREHOLDERS’ EQUITY:
Common Stock, $0.00001 par value,
100,000,000 shares authorized,
18,143,156 and 16,600,451 shares
issued and outstanding as of
December 31, 2007 and 2006,
respectively 181 166
Paid-in-capital 44,970,589 12,252,064
Retained earnings 32,281,312 26,222,408
Statutory reserves 9,014,462 4,523,715
Accumulated other comprehensive
(loss) income (1,649,969) 2,031,891
Total shareholders’ equity 84,616,575 45,030,244
Total liabilities and
shareholders’ equity $132,649,253 $92,958,821
HARBIN ELECTRIC, INC. AND SUBSIDIARIES
CONSOLIDATED STATEMENTS OF INCOME AND OTHER COMPREHENSIVE INCOME
FOR THE YEARS ENDED DECEMBER 31, 2007 AND 2006
2007 2006
REVENUES $65,402,864 $40,415,777
COST OF SALES 32,967,887 20,754,282
GROSS PROFIT 32,434,977 19,661,495
RESEARCH AND DEVELOPMENT EXPENSE 1,064,074 1,491,316
SELLING, GENERAL AND ADMINISTRATIVE
EXPENSES 7,659,611 4,175,944
INCOME FROM OPERATIONS 23,711,292 13,994,235
OTHER EXPENSE (INCOME), NET
Other income, net -- (5,196)
Non-operating expense, net 188,654 40,774
Realized gain on sale of
marketable securities -- (577,071)
Interest expense, net 6,619,954 2,450,248
Change in fair value of warrant -- (6,353,032)
Total other expense (income), net 6,808,608 (4,444,277)
INCOME BEFORE PROVISION FOR INCOME
TAXES 16,902,684 18,438,512
PROVISION FOR INCOME TAXES -- --
NET INCOME 16,902,684 18,438,512
OTHER COMPREHENSIVE INCOME (LOSS)
Foreign currency translation
adjustment 7,162,512 1,034,425
Change in fair value of derivative
instrument (10,844,372) --
COMPREHENSIVE INCOME $13,220,824 $19,472,937
EARNINGS PER SHARE
Basic
Weighted average number of
shares 17,082,300 16,600,451
Earning per share $0.99 $1.11
Diluted
Weighted average number of
shares 18,634,739 18,306,569
Earning per share $0.91 $1.01
HARBIN ELECTRIC, INC. AND SUBSIDIARIES
CONSOLIDATED STATEMENTS OF CASH FLOWS
FOR THE YEARS ENDED DECEMBER 31, 2007 AND 2006
2007 2006
CASH FLOWS FROM OPERATING ACTIVITIES:
Net income $16,902,684 $18,438,512
Adjustments to reconcile net income
to cash provided by (used in) operating
activities:
Depreciation 567,069 373,539
Amortization of intangible assets 510,023 93,889
Amortization of debt issuance
costs 542,438 197,470
Amortization of debt discount 4,532,132 1,510,711
Loss on disposal of equipment -- (1,945)
Bad debt expense 65,876 14,020
Gain on derivative instrument (700,496) --
Realized gain on sale of
marketable securities -- (577,071)
Change in fair value of warrants -- (6,353,032)
Stock based compensation 1,584,234 918,088
Change in operating assets and
liabilities
Accounts receivable (12,197,768) (2,961,574)
Inventories (1,615,757) 788,713
Other receivables (154,244) 72,579
Other receivables - related
parties 46,216 86,538
Advances on inventory purchases (844,177) 1,959,588
Other assets (24,781) (130,972)
Accounts payable (1,302,212) 148,908
Other payables 947,581 401,533
Other payables - Related Party 43,689 --
Accrued liabilities (25,497) 49,118
Customer deposits (7,848) 309,462
Taxes payable 234,702 445,604
Other liabilities -- 7,590
Net cash provided by operating
activities 9,103,864 15,791,268
CASH FLOWS FROM INVESTING
ACTIVITIES:
Advances on intangible assets -- (2,549,389)
Advances on equipment purchases (23,315,185) --
Additions to intangible assets (1,117,024) (1,444,350)
Additions to plant and equipment (12,138,676) (1,579,273)
Proceed from cross currency hedge 554,551 --
Proceeds from sale of marketable
securities -- 1,093,165
Net cash used in investing
activities (36,016,334) (4,479,847)
CASH FLOWS FINANCING ACTIVITIES:
Proceeds received from conversion
of warrants 1,713,193 --
Deposit to secure derivative
instrument (1,000,000) --
Capital contribution -- 36,300
Net proceeds from debt issued -- 47,045,375
Interest payable -- 1,122,000
Net cash provided by financing
activities 713,193 48,203,675
EFFECTS OF EXCHANGE RATE CHANGE IN
CASH 4,419,251 2,059,804
(DECREASE) INCREASE IN CASH (21,780,026) 61,574,900
CASH, beginning of year 67,313,919 5,739,019
CASH, end of year $45,533,893 $67,313,919
For investor and media inquiries, please contact:
Harbin Electric, Inc.
In China
Tel: +86-451-8611-6757
Email: MainlandIR@Tech-full.com
In the U.S.
Christy Shue
Executive VP, Finance & Investor Relations
Tel: +1-631-312-8612
Email: cshue@HarbinElectric.com