BEIJING, November 15, 2012 /PRNewswire-FirstCall/ -- Pactera Technology International Ltd. (Nasdaq: PACT) ("Pactera" or the "Company"), a global consulting and technology services provider strategically headquartered in China, today reported its unaudited financial results for the third quarter ended September 30, 2012, which are described below as the unaudited financial results of former HiSoft Technology International Limited (NASDAQ:HSFT). In addition, we included the unaudited financial results for the third quarter ended September 30,2012 of VanceInfo Technologies Inc. (NYSE: VIT) which was combined with HiSoft Technology International Limited to form Pactera on November 9, 2012 as a result of the previously announced merger.
Third Quarter 2012 Highlights of former HiSoft Technology International Limited ("HiSoft")
Third Quarter 2012 Highlights of former VanceInfo Technologies Inc. ("VanceInfo")
Tiak Koon Loh, Pactera Chief Executive Officer, commented, "Both HiSoft and VanceInfo finished the quarter with strong, broad-based results executing on strategies to grow higher value-added solution services and further deepen wallet-share." He continued, "These results provide nice momentum from which to establish our combined operations. We have an immediate focus on post-merger integration and a clear vision to drive sustainable business growth. We are committed to capitalizing on the synergies that lay before us and delivering solid results to our customers and shareholders."
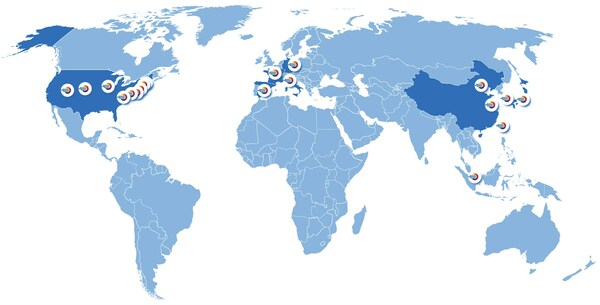
"We announced the official formation of Pactera on November 9, 2012, and through the merger of VanceInfo and HiSoft we bring together the skills of more than 23,000 employees to create a world-class China-based IT services company," said Pactera Non-Executive Chairman, Chris Chen. "By building on the two firms' complementary strengths, Pactera's 13 offices in China and 14 international sites create an integrated, global network of resources that offer clients an expanded breadth of solution services serving a variety of industries with world-wide reach. We are indeed excited about the capabilities that Pactera brings to the marketplace and a bright future ahead," he concluded.
HiSoft Third Quarter 2012 Financial Results
Net Revenues
Net revenues were $79.6 million for the third quarter of 2012, an increase of 35.2% from $58.9 million for the corresponding period in 2011. The strong year-over-year growth in net revenues was driven by strong demand across all service lines and key geographic markets.
Net Revenues by Service Line
HiSoft had two service lines: Information Technology ("IT") services and research and development ("R&D") services. HiSoft divided IT services into two categories: consulting and packaged solution services ("CPS") and application development, testing and maintenance services ("ADM").
Three Months Ended September 30, 2012 | Three Months Ended September 30, 2011 | Year-over-Year % Change | |||
($ in thousands, except percentages) | |||||
IT Services | 46,242 | 58.1% | 34,084 | 57.9% | 35.7% |
CPS | 17,380 | 21.8% | 11,823 | 20.1% | 47.0% |
ADM | 28,862 | 36.3% | 22,261 | 37.8% | 29.7% |
R&D Services | 33,330 | 41.9% | 24,790 | 42.1% | 34.4% |
Total Net Revenues | 79,572 | 100.0% | 58,874 | 100.0% | 35.2% |
Net revenues from IT services were $46.2 million for the third quarter of 2012, an increase of 35.7% from $34.1 million for the corresponding period in 2011. HiSoft's CPS services grew 47.0% compared to the same period in 2011 as a result of expanded solution offerings and an expanded client portfolio.
Net revenues from R&D services were $33.3 million for the third quarter of 2012, an increase of 34.4% from $24.8 million for the corresponding period in 2011.
Net Revenues by Geographic Markets
Net Revenues based on Location of Clients' Headquarters
Three Months Ended September 30, 2012 | Three Months Ended September 30, 2011 | Year-over-Year % Change | |||
($ in thousands, except percentages) | |||||
United States | 36,359 | 45.7% | 29,847 | 50.7% | 21.8% |
Greater China | 18,169 | 22.8% | 10,251 | 17.4% | 77.2% |
Japan | 14,235 | 17.9% | 10,056 | 17.1% | 41.6% |
Asia South | 6,081 | 7.7% | 3,603 | 6.1% | 68.8% |
Europe | 4,728 | 5.9% | 5,117 | 8.7% | (7.6%) |
Total Net Revenues | 79,572 | 100.0% | 58,874 | 100.0% | 35.2% |
Based on the location of clients' headquarters, HiSoft's largest geographic market, the United States accounted for $36.4 million or 45.7% of net revenues during the third quarter of 2012, followed by 22.8% for Greater China, 17.9% for Japan, 7.7% for Asia South and 5.9% for Europe.
In the third quarter, Greater China continued its strong growth momentum of 77.2% year-over-year. The United States and Japan also continued to demonstrate solid momentum recording year-over-year net revenue growth of 21.8% and 41.6%, respectively. Asia South recorded a 68.8% increase in revenue year-over-year primarily due to an acquisition in Australia in the third quarter 2012. Growth from Europe was negatively impacted by adverse macro-economic conditions resulting in a 7.6% year-over-year decrease.
Net Revenues based on Location of Contract Signing Entity
Three Months Ended September 30, 2012 | Three Months Ended September 30, 2011 | Year-over-Year % Change | |||
($ in thousands, except percentages) | |||||
Greater China | 33,970 | 42.7% | 22,689 | 38.5% | 49.7% |
United States | 15,764 | 19.8% | 14,829 | 25.2% | 6.3% |
Japan | 15,244 | 19.1% | 11,530 | 19.6% | 32.2% |
Asia South | 12,945 | 16.3% | 8,455 | 14.4% | 53.1% |
Europe | 1,649 | 2.1% | 1,371 | 2.3% | 20.3% |
Total Net Revenues | 79,572 | 100.0% | 58,874 | 100.0% | 35.2% |
Measuring HiSoft's net revenues based on the location of contract signing entity, Greater China accounted for 42.7% of net revenues in the third quarter of 2012, while the United States accounted for 19.8%, Japan accounted for 19.1%, Asia South accounted for 16.3% and Europe accounted for 2.1%.
In the third quarter of 2012, HiSoft achieved strong year-over-year net revenue growth based on the location of contract signing entity across most of its key markets: the United States grew 6.3%, Japan grew 32.2%, Greater China grew 49.7%, Asia South grew 53.1% and Europe grew 20.3%.
Largest Clients
Revenues from HiSoft's top five and top ten clients accounted for 29.8% and 43.8% of net revenues, respectively, during the third quarter of 2012, compared to 34.5% and 49.5%, respectively, for the corresponding period in 2011.
Gross Profit and Gross Margin
Gross profit was $28.3 million for the third quarter of 2012, an increase of 35.1% from $20.9 million for the corresponding period in 2011. During the third quarter of 2012, gross margin was 35.6%, unchanged from the corresponding period in 2011.
Non-GAAP gross margin was 36.0% for the third quarter of 2012, compared to 35.9% in the corresponding period in 2011.
Operating Expenses
Total operating expenses were $23.0 million for the third quarter of 2012, an increase of 36.3% from $16.9 million for the corresponding period in 2011. Total operating expenses as percentage of total revenues was 28.9%, compared to 28.7% for the corresponding period in 2011.
Operating Income and Operating Margin
Operating income for the third quarter of 2012 was $5.3 million, an increase of 30.2% from $4.1 million for the corresponding period in 2011. Non-GAAP operating income for the third quarter in 2012 was $11.2 million, an increase of 41.9% from $7.9 million for the corresponding period in 2011.
Operating margin was 6.7% for the third quarter of 2012, compared to 6.9% for the same period in 2011. Non-GAAP operating margin was 14.1% for the third quarter of 2012, compared to 13.4% for the corresponding period in 2011.
Provision for Income Taxes
Provision for income taxes was $1.3 million for the third quarter of 2012, compared to $0.4 million in the third quarter of 2011.
The effective tax rate for the third quarter of 2012 was 21.0%. Excluding non-deductible merger related transaction costs for Cayman Island tax purposes, the effective tax rate would have been 15.0% for the quarter.
Net Income and Net Income per ADS
Net income attributable to HiSoft was $4.7 million for the third quarter of 2012, compared to $4.4 million for the corresponding period in 2011. Diluted net income per ADS was $0.15 for the third quarter of 2012, improved from $0.14 in the corresponding period of 2011.
Non-GAAP net income was $10.6 million for the third quarter of 2012, an increase of 28.3% from $8.2 million for the same period in 2011. Non-GAAP diluted net income per ADS was $0.33 in the third quarter of 2012, compared to $0.26 in the corresponding period of 2011.
Cash Flow and DSO
As of September 30, 2012, HiSoft had cash and cash equivalents, restricted cash, and term deposits totaling $120.7 million. Operating cash flow for third quarter of 2012 was a net inflow of approximately $5.1 million.
Days sales outstanding ("DSO") was 99 days for the third quarter of 2012, compared to 88 days in the corresponding period of 2011. The increase in DSO was primarily due to an increase in the number of fixed- price contracts signed with customers in China and Singapore.
First Nine Months 2012 Financial Results of HiSoft
Net Revenues
Net revenues were $216.8 million for the nine months ended September 30, 2012, an increase of 40.7% from $154.1 million for the corresponding period in 2011.
Net Revenues by Service Line
Nine Months Ended September 30, 2012 | Nine Months Ended September 30, 2011 | Year-over-Year % Change | |||
($ in thousands, except percentages) | |||||
IT Services | 127,120 | 58.6% | 86,405 | 56.1% | 47.1% |
CPS | 47,756 | 22.0% | 23,927 | 15.5% | 99.6% |
ADM | 79,364 | 36.6% | 62,478 | 40.6% | 27.0% |
R&D Services | 89,709 | 41.4% | 67,648 | 43.9% | 32.6% |
Total Net Revenues | 216,829 | 100.0% | 154,053 | 100.0% | 40.7% |
Net revenues from IT services were $127.1 million for the nine months ended September 30, 2012, an increase of 47.1% from $86.4 million for the corresponding period in 2011. HiSoft's CPS services, comprising a portfolio of higher value-added solutions, recorded a 99.6% year-over-year increase.
Net revenues from R&D services were $89.7 million for the nine months ended September 30, 2012, an increase of 32.6% from $67.6 million for the corresponding period in 2011.
Net Revenues by Geographic Markets
Net Revenues based on Location of Clients' Headquarters
Nine Months Ended September 30, 2012 | Nine Months Ended September 30, 2011 | Year-over-Year % Change | |||
($ in thousands, except percentages) | |||||
United States | 99,608 | 45.9% | 77,601 | 50.4% | 28.4% |
Greater China | 50,374 | 23.2% | 26,213 | 17.0% | 92.2% |
Japan | 41,395 | 19.1% | 27,401 | 17.8% | 51.1% |
Europe | 14,112 | 6.5% | 13,943 | 9.0% | 1.2% |
Asia South | 11,340 | 5.3% | 8,895 | 5.8% | 27.5% |
Total Net Revenues | 216,829 | 100.0% | 154,053 | 100.0% | 40.7% |
Based on the location of clients' headquarters, HiSoft's largest geographic market, the United States, accounted for $99.6 million or 45.9% of its net revenues, during the nine months ended September 30, 2012, followed by 23.2 % for Greater China, 19.1% for Japan, 6.5% for Europe and 5.3% for Asia South.
Net Revenues based on Location of Contract Signing Entity
Nine Months Ended September 30, 2012 | Nine Months Ended September 30, 2011 | Year-over-Year % Change | |||
($ in thousands, except percentages) | |||||
Greater China | 89,916 | 41.5% | 60,408 | 39.2% | 48.8% |
United States | 46,406 | 21.4% | 34,435 | 22.4% | 34.8% |
Japan | 44,294 | 20.4% | 33,480 | 21.7% | 32.3% |
Asia South | 32,402 | 14.9% | 21,879 | 14.2% | 48.1% |
Europe | 3,811 | 1.8% | 3,851 | 2.5% | (1.0%) |
Total Net Revenues | 216,829 | 100.0% | 154,053 | 100.0% | 40.7% |
Measuring HiSoft's net revenues based on the location of contract signing entities, Greater China accounted for 41.5% of its net revenues in the nine months ended September 30, 2012, while the United States accounted for 21.4%, Japan accounted for 20.4%, Asia South accounted for 14.9% and Europe accounted for 1.8%.
Largest Clients
Revenues from HiSoft's top five and top ten clients accounted for 31.2% and 44.3% of its net revenues, respectively, during the nine months ended September 30, 2012, compared to 36.8% and 52.5%, respectively, for the corresponding period in 2011.
Gross Profit and Gross Margin
Gross profit was $76.8 million for the nine months ended September 30, 2012, an increase of 44.9% from $53.0 million for the corresponding period in 2011. For the nine months ended September 30, 2012, gross margin was 35.4%, compared to 34.4% for the corresponding period in 2011.
Operating Income and Operating Margin
Operating income for the nine months ended September 30, 2012 was $18.5 million, an increase of 75.6% from $10.5 million for the corresponding period in 2011. Non-GAAP operating income for the nine months ended September 2012 was $30.0 million, an increase of 65.7% from $18.1 million for the corresponding period in 2011.
Operating margin was 8.5% for the nine months ended September 30, 2012, compared to 6.8% for the corresponding period in 2011. Non-GAAP operating margin was 13.9% for the third quarter of 2012, compared to 11.8% for the corresponding period in 2011.
Provision for Income Taxes
Provision for income taxes was $3.6 million for the nine months ended September 30, 2012, compared to a $1.3 million for the corresponding period in 2011. The increase in income tax rate was primarily a result of the phasing out of the preferential tax rates for some of HiSoft's operating entities.
Effective tax rate was 17% for the nine months ended September 30, 2012. Excluding certain non-deductible merger-related transaction costs for Cayman islands tax purposes, the effective tax rate would have been 15.0% for the nine months ended September 30, 2012.
Net Income and Net Income per ADS
Net income attributable to HiSoft was $17.1 million for the nine months ended September 30, 2012, an increase of 54.1%, compared to $11.1 million for the corresponding period in 2011. Diluted net income per ADS was $0.54 for the nine months ended September 30, 2012, compared to $0.35 for the corresponding period in 2011.
Non-GAAP net income was $28.7 million for the nine months ended September 30, 2012, an increase of 53.2% from $18.7 million for the corresponding period in 2011. Non-GAAP diluted net income per ADS was $0.90 for the nine months ended September 30, 2012 compared to $0.59 for the corresponding period in 2011.
Cash Flow and DSO
Operating cash flow for the nine months ended September 30, 2012 was a net inflow of approximately $3.0 million.
Days sales outstanding was 96 days for the nine-month period ending September 30, 2012.
Third Quarter 2012 Financial Results of VanceInfo
Net Revenues
Net revenues were $96.2 million in the third quarter of 2012, up 36.9% from $70.3 million for the third quarter of 2011. The increase in net revenues was attributable to the demand from most of the markets VanceInfo served, except the European market.
Net Revenues by Service Line
VanceInfo provided four service lines: R&D Outsourcing Services ("RDS"), Consulting and Solutions Services ("C&S"), Application Management Services ("AMS") and Other Solutions & Services ("Others").
Consistent with the VanceInfo's growth strategy, net revenues from C&S grew 107.8% over the same period in 2011 and contributed 13.2% of total net revenues in the third quarter of 2012. Net revenues from AMS increased 35.5% from the third quarter of 2011, accounting for 37.1% of total net revenues in the third quarter of 2012.
Three Months Ended September 30, 2012 | Three Months Ended September 30, 2011 | Year-over-Year % Change | |||
($ in thousands, except percentages) | |||||
RDS | 43,255 | 45.0% | 34,601 | 49.2% | 25.0% |
C&S | 12,748 | 13.2% | 6,135 | 8.7% | 107.8% |
AMS | 35,704 | 37.1% | 26,343 | 37.5% | 35.5% |
Others | 4,533 | 4.7% | 3,215 | 4.6% | 41.0% |
Total net revenues | 96,240 | 100.0% | 70,294 | 100.0% | 36.9% |
Net Revenues by Geographic Markets
Net Revenues based on Location of Clients' Headquarters
Three Months Ended | Three Months Ended | Year-over-Year | |||
($ in thousands, except percentages) | |||||
Greater China | 49,318 | 51.2% | 32,939 | 46.9% | 49.7% |
United States | 31,261 | 32.5% | 22,927 | 32.6% | 36.4% |
Europe | 8,639 | 9.0% | 11,097 | 15.8% | (22.2)% |
Japan | 4,268 | 4.4% | 2,529 | 3.6% | 68.8% |
Others | 2,754 | 2.9% | 802 | 1.1% | 243.4% |
Total | 96,240 | 100.0% | 70,294 | 100.0% | 36.9% |
Based on the location of clients' headquarters, net revenues from Greater China were $49.3 million or 51.2% of total net revenues in the third quarter of 2012, followed by 32.5% from the United States, 9.0% from Europe and 4.4% from Japan.
Measuring the VanceInfo's revenues by geographic markets based on the location of the contract signing entities, Greater China accounted for 69.3% of total net revenues in the third quarter of 2012, while the United States accounted for 23.5% in the same period.
Net Revenues by Industry
VanceInfo classified its clients into four industry segments: Telecommunications ("Telecom"), High Technology ("High Tech"), Banking, Financial Services and Insurance ("BFSI"), and other industry segments including manufacturing, retail, distribution, travel and transportation and public services ("Others").
Three Months Ended September 30, 2012 | Three Months Ended September 30, 2011 | Year-over-Year % Change | |||
($ in thousands, except percentages) | |||||
Telecom | 33,725 | 35.0% | 27,510 | 39.1% | 22.6% |
High Tech | 30,713 | 31.9% | 23,186 | 33.0% | 32.5% |
BFSI | 18,434 | 19.2% | 8,603 | 12.2% | 114.3% |
Others | 13,368 | 13.9% | 10,995 | 15.7% | 21.6% |
Total net revenues | 96,240 | 100.0% | 70,294 | 100.0% | 36.9% |
Largest Clients
Revenues from VanceInfo's top five clients totaled $46.7 million or 48.6% of total net revenues in the third quarter of 2012, compared to 50.2% in the third quarter of 2011.
Gross Profit and Gross Margin
Gross profit in the third quarter of 2012 was $30.2 million, an increase of 26.0% from $24.0 million in the third quarter of 2011. Gross margin was 31.4% in the third quarter of 2012, compared to 34.1% in the third quarter of 2011.
Operating Income and Operating Margin
Operating income in the third quarter of 2012 was $5.1 million, compared to $2.6 million in the third quarter of 2011. Non-GAAP operating income in the third quarter of 2012 was $8.5 million, up 54.5% from $5.5 million in the same period in 2011. Non-GAAP operating margin was 8.9% in the third quarter of 2012, compared to 7.9% in the third quarter of 2011. The year-over-year increase of Non-GAAP operating margin was primarily due to the higher pre-sale expenses associated with VanceInfo's strategic investment in BFSI consulting and solutions capabilities in September 2011.
Provision for Income Taxes
The effective income tax rate was 15.9%, compared to 4.8% in the same period of 2011. The higher effective income tax rate reflected the expiration of tax holiday in 2012 of a major China-based operating subsidiary.
Net Income and EPS
Net income in the third quarter of 2012 was $4.9 million, up 54.3% from $3.2 million in the third quarter of 2011. Non-GAAP net income was $8.3 million in the third quarter of 2012, up 35.8% from $6.1 million in the same period in 2011. Non-GAAP net margin was 8.7% in the third quarter of 2012, which was the same as the third quarter 2011.
For the third quarter of 2012, diluted EPS and Non-GAAP diluted EPS were $0.11 and $0.19, respectively, compared with $0.07 and $0.14, respectively, for the third quarter of 2011.
Cash Flow and DSO
As of September 30, 2012, VanceInfo had cash and cash equivalents, restricted cash, term deposits and short-term investments totaling $80.2 million. Operating cash flow in the third quarter of 2012 was a net inflow of approximately $5.6 million.
Days sales outstanding ("DSO") was 143 days for the third quarter of 2012, compared to 132 for the second quarter of 2012. DSO was 130 days for the trailing twelve months ended September 30, 2012, compared with 128 days for the trailing twelve months ended June 30, 2012.
First Nine Months 2012 Financial Results of VanceInfo
Net Revenues
Net revenues for the first nine months of 2012 were $277.1 million, up 41.4% from $195.9 million in the first nine months of 2011.
Net Revenues by Service Line
Nine Months Ended September 30, 2012 | Nine Months Ended September 30, 2011 | Year-over-Year % Change | |||
($ in thousands, except percentages) | |||||
RDS | 133,169 | 48.1% | 104,610 | 53.4% | 27.3% |
C&S | 34,189 | 12.3% | 16,310 | 8.3% | 109.6% |
AMS | 97,492 | 35.2% | 67,625 | 34.5% | 44.2% |
Others | 12,243 | 4.4% | 7,404 | 3.8% | 65.4% |
Total net revenues | 277,093 | 100.0% | 195,949 | 100.0% | 41.4% |
Net Revenues by Geographic Markets
Net Revenues based on Location of Clients' Headquarters
Nine Months Ended September 30, 2012 | Nine Months Ended September 30, 2011 | Year-over-Year % Change | |||
($ in thousands, except percentages) | |||||
Greater China | 135,167 | 48.8% | 92,151 | 47.0% | 46.7% |
United States | 94,268 | 34.0% | 63,937 | 32.6% | 47.4% |
Europe | 28,846 | 10.4% | 31,439 | 16.0% | -8.2% |
Japan | 12,032 | 4.3% | 6,606 | 3.4% | 82.1% |
Others | 6,780 | 2.5% | 1,816 | 1.0% | 273.3% |
Total Net Revenues | 277,093 | 100.0% | 195,949 | 100.0% | 41.4% |
Based on the location of its clients' headquarters, Greater China was VanceInfo's largest geographic market, accounting for $135.2 million or 48.8% of the net revenues in the first nine months of 2012, followed by 34.0% from clients headquartered in the United States, 10.4% in Europe and 4.3% in Japan.
Measuring VanceInfo's revenues by geographic markets based on the location of the contract signing entities, rather than the location of the clients' headquarters, Greater China accounted for 67.7% of net revenues in the first nine months of 2012, while the United States accounted for 25.3% in the same period.
Net Revenues by Industry
Nine Months Ended September 30, 2012 | Nine Months Ended September 30, 2011 | Year-over-Year % Change | |||
($ in thousands, except percentages) | |||||
Telecom | 99,314 | 35.8% | $80,852 | 41.3% | 22.8% |
High Tech | 93,815 | 33.9% | 64,800 | 33.1% | 44.8% |
BFSI | 47,723 | 17.2% | 22,619 | 11.5% | 111.0% |
Others | 36,241 | 13.1% | 27,678 | 14.1% | 30.9% |
Total net revenues | 277,093 | 100.0% | 195,949 | 100.0% | 41.4% |
Largest Clients
Revenues from the top five clients totaled 51.7% of VanceInfo's net revenues in the first nine months of 2012, compared to 53.1% in the same period in 2011.
Gross Profit and Gross Margin
Gross profit for the first nine months of 2012 was $88.2 million, an increase of 25.4% from $70.3 million in the first nine months of 2011. Gross margin was 31.8% in the first nine months of 2012, compared to 35.9% in the prior year period.
Operating Income and Operating Margin
Operating income in the first nine months of 2012 was $13.8 million, compared with $17.1 million in the same period last year. Non-GAAP operating income in the first nine months of 2012 was $24.3 million, compared with $24.5 million in the same period last year. Non-GAAP operating margin was 8.8% in the first nine months of 2012, compared to 12.5% in the year-ago period.
Net Income and EPS
Net income for the first nine months of 2012 was $12.9 million, compared to $17.3 million for the same period of 2011. Non-GAAP(1) net income was $23.4 million for the first nine months of 2012, compared with $24.7 million a year ago. Non-GAAP net margin(1) was 8.5%, compared with 12.6% in the first nine months of 2011. Diluted EPS for the first nine months of 2012 was $0.30, compared to $0.38 in the same period of 2011. Non-GAAP diluted EPS was $0.54 for the first nine months of 2012, which was the same as the first nine months of 2011.
Outlook for Pactera's Fourth Quarter 2012
For the fourth quarter of 2012, based on current market and operating conditions and current book orders, Pactera expects:
These estimates are based on current market and operating conditions, are subject to change, and may be influenced positively or negatively by factors outside the Company's control, including but not limited to macroeconomic events in the markets in which the Company operates. See "Safe Harbor Statement" below for additional information regarding forward-looking statements.
Conference Call
The Company will host a combined earnings conference call and live webcast at 7:00 AM Eastern Standard Time (EST) on Thursday, November 15, 2012 (8:00 PM Beijing/Hong Kong time). Management will discuss the quarter results and highlights of both companies respectively and answer questions from investors. Please dial-in five minutes prior to the call to register and receive further instruction.
This combined earnings conference call replaces the previously announced third quarter 2012 earnings conference calls for HiSoft and VanceInfo, respectively.
The dial-in details for the live conference call are as below:
-- U.S. Toll Free Dial-in Number: + 1.866.519.4004
-- International Dial-in Number: + 65.6723.9381
-- Hong Kong Dial-in Number: + 852.2475.0994
-- Passcode: 44087166
The conference call will be available live via webcast on the Investors section of Pactera's website at http://ir.pactera.com . The archive replay will be available on Pactera's website shortly after the call.
A dial-in replay of the conference call will be available until November 23, 2012:
-- U.S. Toll Free Dial-in Number: + 1.866.214.5335
-- International Dial-in Number: + 61.2.8235.5000
-- Passcode: 44087166
About Pactera
Pactera Technology International Ltd. (NASDAQ: PACT), formed by a merger of equals between HiSoft Technology International Limited and VanceInfo Technologies Inc., is a global consulting and technology services provider strategically headquartered in China. Pactera provides world-class business / IT consulting, solutions, and outsourcing services to a wide range of leading multinational firms through a globally integrated network of onsite and offsite delivery locations in China, the United States, Europe, Australia, Japan, Singapore and Malaysia. Pactera's comprehensive services include business and technology advisory, enterprise application services, business intelligence, application development & maintenance, mobility, cloud computing, infrastructure management, software product engineering & globalization, and business process outsourcing.
For more information about Pactera, please visit www.pactera.com.
Safe Harbor Statement
This news release contains forward-looking statements. These statements constitute "forward-looking" statements within the meaning of Section 21E of the Securities Exchange Act of 1934, as amended, and as defined in the U.S. Private Securities Litigation Reform Act of 1995. These forward-looking statements can be identified by terminology such as "will," "expects," "anticipates," "future," "intends," "plans," "believes," "estimates," "target," "going forward," "outlook" and similar statements. Such statements are based upon management's current expectations and current market and operating conditions, and relate to events that involve known or unknown risks, uncertainties and other factors, all of which are difficult to predict and many of which are beyond Pactera's control, which may cause Pactera's actual results, performance or achievements to differ materially from those in the forward-looking statements. Potential risks and uncertainties include, but are not limited to, the Company's dependence on a limited number of clients for a significant portion of its revenues, uncertainty relating to its clients' forming or plan to form joint venture with the Company's clients, the economic slowdown in its principal geographic markets, the quality and portfolio of its service lines and industry expertise, and the availability of a large talent pool in China and inflation of qualified professionals' wages, as well as the PRC government's investment in infrastructure construction and adoption of various incentives in the IT service industry. Further information regarding these and other risks, uncertainties or factors is included in Pactera's filings with the U.S. Securities and Exchange Commission. All information provided in this news release is as of the date of this news release, and Pactera does not undertake any obligation to update any forward-looking statement as a result of new information, future events or otherwise, except as required under applicable law.
About Non-GAAP Financial Measures
To supplement Pactera's consolidated financial results presented in accordance with GAAP, Pactera uses the following measures defined as non-GAAP financial measures by the SEC: non-GAAP income from operations, non-GAAP net income and non-GAAP diluted EPS and related margins which exclude share-based compensation expense, amortization of acquired intangible assets and land use right, merger-related costs, change in fair value of contingent consideration payable for business acquisition, and compensation expenses related to acquisition. The non-GAAP income from operations, net income and diluted EPS for prior periods have been reclassified so that the presentations are consistent. The presentation of these non-GAAP financial measures is not intended to be considered in isolation or as a substitute for or superior to the financial information prepared and presented in accordance with GAAP or as being comparable to results reported or forecasted by other companies. For more information on these non-GAAP financial measures, please see the tables captioned "Reconciliations of non-GAAP Financial Measures to Comparable GAAP Measures" and "Reconciliations of Forward-Looking Guidance for non-GAAP Financial Measures to Comparable GAAP Measures" set forth at the end of this news release.
Pactera believes that these non-GAAP financial measures provide meaningful supplemental information regarding its performance by excluding certain expenses and expenditures that may not be indicative of its operating performance. The Company believes that both management and investors benefit from referring to these non-GAAP financial measures in assessing the Company's performance and when planning and forecasting future periods. A limitation of using non-GAAP net income and non-GAAP diluted EPS is that these non-GAAP measures exclude the share-based compensation charges, amortization of acquired intangible assets and land use right, merger-related transaction and integration costs, and change in fair value of contingent consideration payable for business acquisition that have been and will continue to be, for the foreseeable future, a significant recurring expense in the business. Management compensates for these limitations by providing specific information regarding the GAAP amounts excluded from each non-GAAP measure. The accompanying tables have more details on the reconciliations between GAAP financial measures that are comparable to non-GAAP financial measures. The reconciliations of the forward-looking guidance for non-GAAP financial measures to the most directly comparable GAAP financial measures in the accompanying table include all information reasonably available to Pactera at the date of this news release.
(1) Non-GAAP gross profit, non-GAAP operating income, non-GAAP net income, non-GAAP basic and diluted net income per ADS and corresponding margins presented in this press release exclude share-based compensation expense, amortization of acquired intangible assets and land use right, merger-related transaction and integration costs, and change in fair value of contingent consideration payable for business acquisition and compensation expenses related to acquisition. The non-GAAP measures and related reconciliations to GAAP measures are described in the accompanying section of "About Non-GAAP Financial Measures" and the accompanying tables of "Reconciliations of Non-GAAP Financial Measures to Comparable GAAP Measures" and "Reconciliations of Forward-Looking Guidance for Non-GAAP Financial Measures to Comparable GAAP Measures" at the end of the news release. |
(2) Based on equivalent weighted average ADSs outstanding of HiSoft for the three months ended September 30, 2012, each American depositary share representing 19 common shares. |
(3) Based on weighted average ordinary shares outstanding of VanceInfo for the three months ended September 30, 2012. |
HISOFT TECHNOLOGY INTERNATIONAL LIMITED | ||||||
Condensed Consolidated Balance Sheets (Unaudited) | ||||||
(US dollars in thousands, except share data) | ||||||
September 30, 2012 | December 31, 2011 | |||||
ASSETS | ||||||
Current Assets | ||||||
Cash and cash equivalents | 102,487 | 113,856 | ||||
Restricted cash | 2,030 | 1,222 | ||||
Term deposits | 16,186 | 21,681 | ||||
Account receivable, net | 90,140 | 61,413 | ||||
Other current assets | 17,007 | 7,135 | ||||
Total current assets | 227,850 | 205,307 | ||||
Property, plant and equipment, net | 13,329 | 13,774 | ||||
Goodwill and intangible assets, net | 67,327 | 52,546 | ||||
Other long-term assets | 4,561 | 1,552 | ||||
Total assets | 313,067 | 273,179 | ||||
LIABILITIES AND EQUITY | ||||||
Current liabilities | 61,224 | 51,029 | ||||
(including current liabilities of the consolidated variable interest entity without recourse to Hisoft Technology International Limited of $242 and $238 as of September 30, 2012 and December 31, 2011, respectively) | ||||||
Other liabilities | 17,196 | 12,260 | ||||
Total liabilities | 78,420 | 63,289 | ||||
Total shareholder's equity | 234,647 | 209,890 | ||||
Total liabilities and equity | 313,067 | 273,179 | ||||
Note: | ||||||
As of September 30, 2012, there were 625,867,996 ordinary shares (32,940,421 ADSs) issued and outstanding. | ||||||
As of December 31, 2011, there were 595,868,033 ordinary shares (31,361,475 ADSs) issued and outstanding.
| ||||||
HISOFT TECHNOLOGY INTERNATIONAL LIMITED | ||||||||||
Condensed Consolidated Statements of Operations (Unaudited) | ||||||||||
(US dollars in thousands, except for share, per share data) | ||||||||||
Three months ended September 30, | Nine months ended September 30, | |||||||||
2012 | 2011 | 2012 | 2011 | |||||||
Net revenues | 79,572 | 58,874 | 216,829 | 154,053 | ||||||
Cost of revenues | (51,270) | (37,925) | (140,013) | (101,025) | ||||||
Gross profit | 28,302 | 20,949 | 76,816 | 53,028 | ||||||
Operating expenses | (23,008) | (16,882) | (58,362) | (42,519) | ||||||
Income from operations | 5,294 | 4,067 | 18,454 | 10,509 | ||||||
Other income | 833 | 854 | 2,888 | 2,073 | ||||||
Net income before income tax expenses | 6,127 | 4,921 | 21,342 | 12,582 | ||||||
Income tax expenses | (1,287) | (416) | (3,569) | (1,259) | ||||||
Net income | 4,840 | 4,505 | 17,773 | 11,323 | ||||||
Less: Net income attributable to noncontrolling interest | (174) | (92) | (666) | (219) | ||||||
Net income attributable to Hisoft Technology International Limited | ||||||||||
4,666 | 4,413 | 17,107 | 11,104 | |||||||
Net income per share | ||||||||||
Basic | 0.01 | 0.01 | 0.03 | 0.02 | ||||||
Diluted | 0.01 | 0.01 | 0.03 | 0.02 | ||||||
Weighted average shares used in calculating net income per common share | ||||||||||
Basic | 578,534,651 | 595,251,268 | 576,313,461 | 586,484,199 | ||||||
Diluted | 600,326,570 | 597,081,354 | 600,993,414 | 599,159,307 | ||||||
Net income per ADS | ||||||||||
Basic | 0.15 | 0.14 | 0.56 | 0.36 | ||||||
Diluted | 0.15 | 0.14 | 0.54 | 0.35 | ||||||
Weighted average ADS used in calculating net income per ADS | ||||||||||
Basic | 30,449,192 | 31,329,014 | 30,332,287 | 30,867,589 | ||||||
Diluted | 31,596,135 | 31,425,334 | 31,631,232 | 31,534,700 | ||||||
HISOFT TECHNOLOGY INTERNATIONAL LIMITED | |||||||||||
Condensed Consolidated Statements of Comprehensive Income (Unaudited) | |||||||||||
(US dollars in thousands, except for share, per share data) | |||||||||||
Three months ended September 30, | Nine months ended September 30, | ||||||||||
2012 | 2011 | 2012 | 2011 | ||||||||
Net income | 4,840 | 4,505 | 17,773 | 11,323 | |||||||
Other comprehensive income, net of tax: | |||||||||||
Change in cumulative foreign exchange translation adjustment | 2,491 | 739 | 1,513 | 3,876 | |||||||
Comprehensive income | 7,331 | 5,244 | 19,286 | 15,199 | |||||||
Less: Comprehensive income attributable to noncontrolling interest | |||||||||||
(195) | (104) | (673) | (252) | ||||||||
Comprehensive income attributable to Hisoft Technology International Limited | |||||||||||
7,136 | 5,140 | 18,613 | 14,947 | ||||||||
HISOFT TECHNOLOGY INTERNATIONAL LIMITED | |||||||||||
CONDENSED CONSOLIDATED STATEMENTS OF CASH FLOWS | |||||||||||
(in U.S. dollars in thousands) | |||||||||||
Three months ended September 30, | Nine months ended September 30, | ||||||||||
2012 | 2011 | 2012 | 2011 | ||||||||
Cash flows from operating activities: | |||||||||||
Net income | $ | 4,840 | $ | 4,505 | $ | 17,773 | $ | 11,323 | |||
Adjustments to reconcile net income to net cash provided by operating activities: | |||||||||||
(Reversal) provision for doubtful accounts | (119) | (3) | (30) | 205 | |||||||
(Gain) loss on disposal of property, plant and equipment | (8) | 6 | (52) | 38 | |||||||
Depreciation | 1,343 | 1,148 | 4,141 | 3,083 | |||||||
Change in fair value of foreign-currency forward contract | (68) | (14) | (23) | 39 | |||||||
Success fee related to business acquisition | - | 450 | - | 450 | |||||||
Amortization of intangible assets | 1,555 | 787 | 3,763 | 1,633 | |||||||
Interest expense | - | - | - | 64 | |||||||
Share-based compensation expenses | 1,417 | 1,806 | 5,223 | 4,097 | |||||||
Changes in fair value of contingent consideration | 463 | 788 | 117 | 1,440 | |||||||
Changes in operating assets and liabilities: | |||||||||||
Accounts receivable | (2,737) | (4,926) | (22,469) | (13,362) | |||||||
Other current assets | (552) | (879) | (2,131) | 1,242 | |||||||
Income tax receivable | - | 1,727 | - | 2,565 | |||||||
Other assets | (696) | (262) | (934) | (329) | |||||||
Accounts payable | (1,245) | (164) | (2,521) | (656) | |||||||
Other liabilities | 862 | (3,449) | 178 | (3,490) | |||||||
Net cash provided by operating activities | 5,055 | 1,520 | 3,035 | 8,342 | |||||||
Cash flows from investing activities: | |||||||||||
Term deposits | 20,036 | (32,356) | 5,324 | (32,356) | |||||||
Purchase of property, plant and equipment | (1,052) | (2,066) | (3,381) | (5,906) | |||||||
Prepayment of buliding purchase (1) | (6,507) | - | (6,507) | - | |||||||
Restricted cash | (582) | (458) | (788) | (782) | |||||||
Deferred and contingent consideration paid for business acquisition | (5,145) | (4,607) | (7,233) | (5,607) | |||||||
Payment of success fee related to business acquisition | - | (450) | - | (450) | |||||||
Net cash provided by (used in) investing activities | 6,750 | (39,937) | (12,585) | (45,101) | |||||||
Cash flows from financing activities: | |||||||||||
Repayment of bank loan | (293) | - | (476) | (40,064) | |||||||
Cash received from non-controlling | - | - | - | 908 | |||||||
Proceeds from issuance of common share under employee option plan | 129 | 489 | 1,399 | 4,658 | |||||||
Deferred and contingent consideration paid for business acquisition | (150) | (4,260) | (3,047) | (9,560) | |||||||
Net cash used in financing activities | (314) | (3,771) | (2,124) | (44,058) | |||||||
Effect of exchange rate changes | 571 | 658 | 305 | 2,597 | |||||||
Net increase (decrease) in cash and cash equivalents | 12,062 | (41,530) | (11,369) | (78,220) | |||||||
Cash and cash equivalents at beginning of period | 90,425 | 133,203 | 113,856 | 169,893 | |||||||
Cash and cash equivalents at end of period | $ | 102,487 | $ | 91,673 | $ | 102,487 | $ | 91,673 | |||
Note 1: We will purchase a campus facility in Wuxi. The facility consists of the building property, and the underlying leased payments for the land use right. The current amount of prepayment in the third quarter of 2012 is principally made for the building portion and accordingly included under investing activities. Any subsequent payments attributable to the leased payments for the land use right will be presented under operating activities. | |||||||||||
HISOFT TECHNOLOGY INTERNATIONAL LIMITED | ||||||||||
Reconciliations of Non-GAAP Financial Measures to Comparable GAAP Measures | ||||||||||
(US dollars in thousands, except per share data and percentages) | ||||||||||
Three months ended September 30, | Nine months ended September 30, | |||||||||
2012 | 2011 | 2012 | 2011 | |||||||
GAAP operating income | 5,294 | 4,067 | 18,454 | 10,509 | ||||||
GAAP operating income % | 6.7% | 6.9% | 8.5% | 6.8% | ||||||
Adjustments: | ||||||||||
- Share-based compensation | 1,417 | 1,806 | 5,223 | 4,097 | ||||||
- Amortization of acquired intangible assets | 1,555 | 787 | 3,763 | 1,633 | ||||||
- Change in fair value of contingent consideration payable for M&A | 463 | 788 | 117 | 1,440 | ||||||
- Success fee related to business acquisition | - | 450 | 450 | |||||||
- Compensation expenses related to acquisition | 87 | - | 87 | - | ||||||
- Merger related costs | 2,388 | - | 2,388 | - | ||||||
Non-GAAP operating income | 11,204 | 7,898 | 30,032 | 18,129 | ||||||
Non-GAAP operating income% | 14.1% | 13.4% | 13.9% | 11.8% | ||||||
GAAP net income | 4,666 | 4,413 | 17,107 | 11,104 | ||||||
GAAP net margin | 5.9% | 7.5% | 7.9% | 7.2% | ||||||
Adjustments: | ||||||||||
- Share-based compensation | 1,417 | 1,806 | 5,223 | 4,097 | ||||||
- Amortization of acquired intangible assets | 1,555 | 787 | 3,763 | 1,633 | ||||||
- Change in fair value of contingent consideration payable for M&A | 463 | 788 | 117 | 1,440 | ||||||
- Success fee related to business acquisition | - | 450 | - | 450 | ||||||
- Compensation expenses related to acquisition | 87 | - | 87 | - | ||||||
- Merger related costs | 2,388 | - | 2,388 | - | ||||||
Non-GAAP net income | 10,576 | 8,244 | 28,685 | 18,724 | ||||||
Non-GAAP net margin | 13.3% | 14.0% | 13.2% | 12.2% | ||||||
Non-GAAP net income per ADS | ||||||||||
Basic | 0.35 | 0.26 | 0.95 | 0.61 | ||||||
Diluted | 0.33 | 0.26 | 0.90 | 0.59 | ||||||
Weighted average ADS used in calculating non-GAAP net income per ADS | ||||||||||
Basic | 30,449,192 | 31,329,014 | 30,332,287 | 30,867,589 | ||||||
Diluted | 31,596,135 | 31,425,334 | 31,631,232 | 31,534,700 | ||||||
GAAP net income per ADS | ||||||||||
Basic | 0.15 | 0.14 | 0.56 | 0.36 | ||||||
Adjustments: | ||||||||||
- Share-based compensation | 0.05 | 0.05 | 0.17 | 0.14 | ||||||
- Amortization of acquired intangible assets | 0.05 | 0.03 | 0.13 | 0.05 | ||||||
- Change in fair value of contingent consideration payable for M&A | 0.02 | 0.03 | 0.01 | 0.05 | ||||||
- Success fee related to business acquisition | - | 0.01 | - | 0.01 | ||||||
- Compensation expenses related to acquisition | - | * | - | - | * | - | ||||
- Merger related costs | 0.08 | - | 0.08 | - | ||||||
Non-GAAP net income per ADS | ||||||||||
Basic | 0.35 | 0.26 | 0.95 | 0.61 | ||||||
GAAP net income per ADS | ||||||||||
Diluted | 0.15 | 0.14 | 0.54 | 0.35 | ||||||
Adjustments: | ||||||||||
- Share-based compensation | 0.04 | 0.05 | 0.16 | 0.13 | ||||||
- Amortization of acquired intangible assets | 0.05 | 0.03 | 0.12 | 0.05 | ||||||
- Change in fair value of contingent consideration payable for M&A | 0.01 | 0.03 | - | 0.05 | ||||||
- Success fee related to business acquisition | - | 0.01 | - | 0.01 | ||||||
- Compensation expenses related to acquisition | - | * | - | - | * | - | ||||
- Merger related costs | 0.08 | - | 0.08 | - | ||||||
Non-GAAP net income per ADS | ||||||||||
Diluted | 0.33 | 0.26 | 0.90 | 0.59 | ||||||
* Less than 0.01 | ||||||||||
VANCEINFO TECHNOLOGIES INC. | |||
Condensed Consolidated Balance Sheets (Unaudited) | |||
(US dollars in thousands, except share data) | |||
September 30, | December 31, | ||
2012 | 2011 | ||
Assets | |||
Current assets | |||
Cash and cash equivalents | 78,431 | 96,170 | |
Term deposits | - | 5,000 | |
Restricted cash | 1,776 | 1,587 | |
Held-to-maturity securities-current | - | 9,401 | |
Account receivable, net | 164,055 | 126,389 | |
Other current assets | 14,929 | 16,042 | |
Total current assets | 259,191 | 254,589 | |
Property and equipment, net | 48,724 | 36,580 | |
Goodwill and other intangible assets | 74,665 | 67,807 | |
Land use right | 23,582 | 23,884 | |
Other long-term assets | 3,910 | 3,036 | |
Total assets | 410,072 | 385,896 | |
Liabilities and equity | |||
Current liabilities | 70,387 | 66,438 | |
Non-current liabilities | 11,636 | 16,014 | |
Total liabilities | 82,023 | 82,452 | |
Equity (a) | 328,049 | 303,444 | |
Total liabilities and equity | 410,072 | 385,896 | |
Note: | |||
(a) As of September 30, 2012, there were 44,833,928 ordinary shares issued and 42,439,355 ordinary shares outstanding, | |||
excluding 2,394,573 treasury stocks in the form of ADSs repurchased from the open market. | |||
VANCEINFO TECHNOLOGIES INC. | |||||||
Condensed Consolidated Statements of Comprehensive income (Unaudited) | |||||||
(US dollars in thousands, except per share data) | |||||||
Three months ended September 30, | Nine months ended September 30, | ||||||
2012 | 2011 | 2012 | 2011 | ||||
Net revenues | 96,240 | 70,294 | 277,093 | 195,949 | |||
Cost of revenues (a) | (66,020) | (46,312) | (188,912) | (125,619) | |||
Gross profit | 30,220 | 23,982 | 88,181 | 70,330 | |||
Operating expenses (a) | (27,236) | (21,768) | (76,618) | (54,252) | |||
Change in fair value of contingent consideration payable | 2,152 | 372 | 2,236 | 974 | |||
Income from operations | 5,136 | 2,586 | 13,799 | 17,052 | |||
Other income | 709 | 764 | 1,543 | 2,083 | |||
Income before income taxes and earnings in equity method | 5,845 | 3,350 | 15,342 | 19,135 | |||
Provision for income taxes | (927) | (160) | (2,441) | (1,848) | |||
Income before earnings in equity method investment | 4,918 | 3,190 | 12,901 | 17,287 | |||
Earnings(Loss)earnings in equity method investment | 4 | - | 35 | (34) | |||
Net income | 4,922 | 3,190 | 12,936 | 17,253 | |||
Income attributable to VanceInfo Technologies Inc. shareholders | 4,922 | 3,190 | 12,936 | 17,253 | |||
Earnings per share | |||||||
Basic - ordinary shares | 0.12 | 0.07 | 0.31 | 0.40 | |||
Diluted - ordinary shares | 0.11 | 0.07 | 0.30 | 0.38 | |||
Net income | 4,922 | 3,190 | 12,936 | 17,253 | |||
Other comprehensive income, net of tax | 2,397 | 2,765 | 853 | 6,275 | |||
Comprehensive income | 7,319 | 5,955 | 13,789 | 23,528 | |||
Comprehensive income attributable to VanceInfo Technologies Inc. | 7,319 | 5,955 | 13,789 | 23,528 | |||
Weighted average shares outstanding (in thousands) | |||||||
Basic - ordinary shares | 42,418 | 43,090 | 42,211 | 43,530 | |||
Diluted - ordinary shares | 43,698 | 44,996 | 43,623 | 45,736 | |||
Note: | |||||||
(a) Depreciation and amortization expenses included in cost of revenues and selling, general and administrative expenses totaled $3,480 and $2,839 for the three months ended September 30, 2012 and 2011, respectively and $10,072 and $7,451 for the nine months ended September 30,2012 and 2011,respectively. | |||||||
Share-base compensation included in cost of revenues and selling, general and administrative expenses totaled $2,276 and $2,262 for the three months ended September 30, 2012 and 2011, respectively and $6,813 and $6,124 for the nine months ended September 30,2012 and 2011,respectively. | |||||||
VANCEINFO TECHNOLOGIES INC. | ||||||||
Condensed Consolidated Statements of Cash Flow (Unaudited) | ||||||||
(US dollars in thousands) | ||||||||
Three months ended September 30, | Nine months ended September 30, | |||||||
2012 | 2011 | 2012 | 2011 | |||||
Cash flows from operating activities: | ||||||||
Net income | 4,922 | 3,190 | 12,936 | 17,253 | ||||
Adjustments to reconcile net income to net cash | ||||||||
provided by operating activities: | ||||||||
Share-based compensation | 2,276 | 2,262 | 6,813 | 6,124 | ||||
Depreciation and amortization of property and equipment | 2,156 | 1,783 | 6,107 | 5,156 | ||||
Amortization of intangible assets | 1,205 | 1,056 | 3,605 | 2,295 | ||||
Amortization of land use right | 119 | - | 360 | - | ||||
Change in fair value of foreign-currency forward contracts | (9) | 32 | (88) | 270 | ||||
Loss on disposal of property and equipment | 29 | 14 | 43 | 21 | ||||
Allowance for doubtful accounts | 185 | 48 | 1,379 | (247) | ||||
Change in fair value of contingent consideration | (2,152) | (372) | (2,236) | (974) | ||||
(Earnings) loss in equity method investment | (5) | - | (36) | 35 | ||||
Gain on remeasurement of fair value | - | (701) | - | (1,215) | ||||
Changes in operating assets and liabilities | ||||||||
Accounts receivable | (11,018) | (137) | (37,759) | (16,017) | ||||
Other current assets | 40 | (23) | 732 | (343) | ||||
Other assets | 2 | (64) | (247) | (45) | ||||
Accounts payable | 389 | 127 | (1,158) | (461) | ||||
Other liabilities | 7,509 | (2,681) | (1,685) | (3,886) | ||||
Prepaid land use right | - | (5,132) | - | (5,132) | ||||
Net cash provided by (used in) operating activities | 5,648 | (598) | (11,234) | 2,834 | ||||
Cash flows from investing activities | ||||||||
Purchase of property and equipment | (2,926) | (1,660) | (7,325) | (5,239) | ||||
Payment for construction in progress | (1,639) | - | (10,078) | - | ||||
Consideration paid for business acquisitions | - | (659) | (694) | (9,745) | ||||
Term deposit | - | - | 5,000 | - | ||||
Restricted cash | 1,395 | (1,104) | (189) | (873) | ||||
Payment for settlement of foreign currency forward exchange contracts | (42) | (339) | (42) | (339) | ||||
Investments - held-to-maturity | 2,000 | 3,245 | 9,250 | 206 | ||||
Net cash used in investing activities | (1,212) | (517) | (4,078) | (15,990) | ||||
Cash flows from financing activities | ||||||||
Proceeds from exercise of options | 340 | (223) | 1,807 | 2,581 | ||||
Payment for issuance costs of ordinary shares upon share offering in 2010 | - | - | - | (52) | ||||
Consideration paid for business acquisitions | (1,072) | - | (4,076) | - | ||||
Repurchase of ordinary shares | - | (7,946) | - | (28,977) | ||||
Short-term bank loan | (1,578) | 24 | 6 | (1,518) | ||||
Net cash used in financing activities | (2,310) | (8,145) | (2,263) | (27,966) | ||||
Effect of exchange rate changes on cash | (127) | 857 | (164) | 1,675 | ||||
Net increase (decrease) in cash and cash equivalents | 2,126 | (9,260) | (17,575) | (41,122) | ||||
Cash and cash equivalents, beginning of period | 76,432 | 130,221 | 96,170 | 161,265 | ||||
Cash and cash equivalents, end of period | 78,431 | 121,818 | 78,431 | 121,818 | ||||
VANCEINFO TECHNOLOGIES INC. | |||||||||||
Reconciliations of Non-GAAP Financial Measures to Comparable GAAP Measures | |||||||||||
(US dollars in thousands, except per share data and percentages) | |||||||||||
Three months ended September 30, 2012 | Three months ended September 30, 2011 | ||||||||||
GAAP | Adjustments | Non-GAAP | GAAP | Adjustments | Non-GAAP | ||||||
Income from operations | $5,136 | $3,410 | (a) | $8,546 | $2,586 | $2,946 | (b) | $5,532 | |||
Operating margin | 5.3% | 3.6% | (a) | 8.9% | 3.7% | 4.2% | (b) | 7.9% | |||
Net income | $4,922 | $3,410 | (a) | $8,332 | $3,190 | $2,946 | (b) | $6,136 | |||
Net margin | 5.1% | 3.6% | (a) | 8.7% | 4.5% | 4.2% | (b) | 8.7% | |||
Diluted EPS | $0.11 | $0.08 | (e) | $0.19 | $0.07 | $0.07 | (e) | $0.14 | |||
Nine months ended September 30, 2012 | Nine months ended September 30, 2011 | ||||||||||
GAAP | Adjustments | Non-GAAP | GAAP | Adjustments | Non-GAAP | ||||||
Income from operations | $13,799 | $10,504 | (c) | $24,303 | $17,052 | $7,445 | (d) | $24,497 | |||
Operating margin | 5.0% | 3.8% | (c) | 8.8% | 8.7% | 3.8% | (d) | 12.5% | |||
Net income | $12,936 | $10,504 | (c) | $23,440 | $17,253 | $7,445 | (d) | $24,698 | |||
Net margin | 4.7% | 3.8% | (c) | 8.5% | 8.8% | 3.8% | (d) | 12.6% | |||
Diluted EPS | $0.30 | $0.24 | (e) | $0.54 | $0.38 | $0.16 | (e) | $0.54 | |||
Notes: | |||||||||||
(a) Adjustment to exclude acquisition related intangible assets amortization expense of $1,205, land use right amortization expense of $119, change in fair value of contingent consideration payable for business acquisition of $(2,152), merger-related costs of $1,962 and share-based compensation of $2,276 from the unaudited condensed consolidated statements of operations. | |||||||||||
(b) Adjustment to exclude acquisition related intangible assets amortization expense of $1,056, change in fair value of contingent consideration payable for business acquisition of $(372) and share-based compensation of $2,262 from the unaudited condensed consolidated statements of operations. | |||||||||||
(c) Adjustment to exclude acquisition related intangible assets amortization expense of $3,605, land use right amortization expense of $360, change in fair value of contingent consideration payable for business acquisition of $(2,236), merger-related costs of $1,962 and share-based compensation of $6,813 from the unaudited condensed consolidated statements of operations. | |||||||||||
(d) Adjustment to exclude acquisition related intangible assets amortization expense of $2,295, change in fair value of contingent consideration payable for business acquisition of $(974), and share-based compensation of $6,124 from the unaudited condensed consolidated statements of operations. | |||||||||||
(e) Non-GAAP diluted EPS is computed by dividing non-GAAP net income attributable to VanceInfo Technologies Inc. by the weighted average number of diluted ordinary shares outstanding used in computing the GAAP diluted EPS for the respective periods. | |||||||||||
PACTERA TECHNOLOGY INTERNATIONAL LTD. | |||||||
Reconciliations of Forward-Looking Guidance for | |||||||
Non-GAAP Financial Measures to Comparable GAAP Measures | |||||||
(US dollars in thousands, except per share data) | |||||||
(Unaudited) | |||||||
Three months ending December 31, 2012 | |||||||
GAAP | Adjustments | Non-GAAP | |||||
Range of Estimate | Range of Estimate | ||||||
Diluted EPS (a) | 0.10 | 0.12 | 0.12 | (b) | 0.22 | 0.24 | |
Notes: | |||||||
(a) Based on 68.9 million total ADS-equivalent average shares outstanding for the fourth quarter 2012. | |||||||
(b) Reflects estimated adjustment for acquisition related intangible assets amortization expenses, land use right amortization expense, merger related transaction costs and share-based compensation expenses of approximately $8.3 million for the fourth quarter 2012. Additional merger integration costs have not been reflected in the adjustment, but will be a non-GAAP adjustment item when the amounts become available. | |||||||
For further information, please contact:
Sheryl Zhang
Investor Relations
Pactera Technology International Ltd.
Tel: +86-10-8282-5330
E-mail: ir@pactera.com