SHANGRAO, China, Aug. 14, 2023 /PRNewswire/ -- JinkoSolar Holding Co., Ltd. ("JinkoSolar" or the "Company") (NYSE: JKS), one of the largest and most innovative solar module manufacturers in the world, today announced its unaudited financial results for the second quarter ended June 30, 2023.
Second Quarter 2023 Business Highlights
Second Quarter 2023 Operational and Financial Highlights
Mr. Xiande Li, JinkoSolar's Chairman and Chief Executive Officer, commented, "We are pleased to report solid growth as we overcame volatility in supply chain prices and end demand thanks to our excellent marketing network, high quality products, and highly effective supply chain management. Module shipments in the second quarter were approximately 17.8 GW, up 36.2% sequentially. Shipments of the competitive N-type module were approximately 10.4 GW, up 74.1% sequentially, making us the first module manufacturer shipping 10 GW of N-type modules in a single quarter globally. Our efforts in supply chain management, technology advancement and process improvement also improved our profitability. Net income was US$180.1 million in the second quarter, up 65.6% sequentially. Adjusted net income was US$196.7 million, up 70.5% sequentially. Diluted earnings per ordinary share were US$0.77, up 48.5% sequentially.
Due to the substantial release of polysilicon production volumes and excessive inventory, price of polysilicon declined sharply in the second quarter, resulting in certain volatility in module prices and a slow-down in customer orders, affecting module demand. As the prices in lower supply chain stabilized in the third quarter, domestic customers started to place orders, and major projects were initiated and started construction in China. The low prices of modules also led to a surge in module demand in some overseas markets. We expect production and sales in the PV market to rebound in the second half of 2023.
With more and more players deploying TOPCon production capacity, N-type TOPCon is certain to become the mainstream technology in the industry. However, some new entrants experienced project delays and slower-than expected ramp up in production volume and efficiency due to lack of sufficient technical know-how and differences in technology and production process, keeping competitive N-type production in short supply. As of the end of the second quarter, the mass-produced efficiency of our 182 mm N-type TOPCon cells had reached 25.5%, with N-type module power output of around 580 wp, 25-30 wp more than P-type module of the same version. We expect mass-produced N-type cell efficiency to reach 25.8%, by the end of 2023. The integrated cost of N-type module remained competitive compared to P-type module.
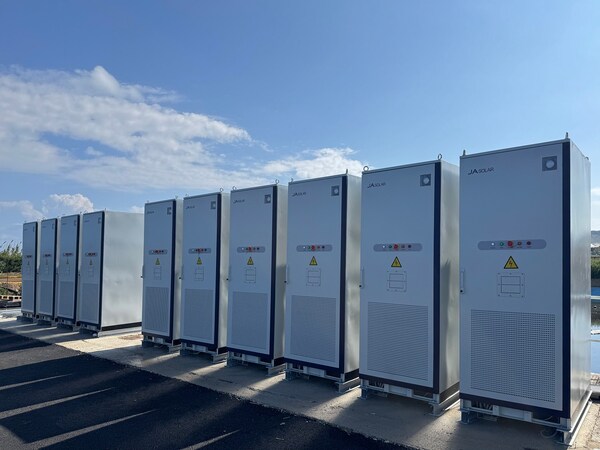
At the end of May, we announced the construction of a major production base of 56 GW integrated wafer-cell-module capacity in Shanxi ("Shanxi Integrated Base"), which will become the largest N-type integrated production facility in the industry. Shanxi Integrated Base is another strategic expansion of the production model championed by JinkoSolar in the PV industry that will fully demonstrate our advantages in highly efficient technology and products, lower investment costs, greater operational efficiency as well as intelligent and smart manufacturing capabilities. Meanwhile, our 1 GW capacity expansion project for N-type modules in the U.S. is expected to start production in September 2023. We have established an industry-leading overseas industrial chain network, with integrated production capabilities from wafer and cell to module, with traceability and excellent product competitiveness. As we continue to invest in N-type capacity expansion overseas in the second half of 2023, we expect to reach an integrated production capacity of over 12 GW overseas by the end of 2023, with the production capacity of N-type accounting for over 75%.
We are optimistic that demand will grow as prices stabilize and raise our module shipment guidance for 2023 to be in the range of 70 to 75 GW, with N-type module accounting for approximately 60% of total module shipments. As demand for N-type products continues to increase in the global market, we will move on to invest in N-type capacity which is competitive both in technology and costs. We expect our annual production capacity for mono wafers, solar cells and solar modules to reach 85.0 GW, 90.0 GW and 110.0 GW, respectively, by the end of 2023, with N-type capacity accounting for over 75% of the total capacity. We expect module shipments to be in the range of 19.0 to 21.0 GW for the third quarter of 2023."
Second Quarter 2023 Financial Results
Total Revenues
Total revenues in the second quarter of 2023 were RMB30.69 billion (US$4.23 billion), an increase of 31.5% from RMB23.33 billion in the first quarter of 2023 and an increase of 62.9% from RMB18.84 billion in the second quarter of 2022. The sequential and year-over-year increases were mainly attributable to the increases in the shipment of solar modules due to the increasing demand in the global market.
Gross Profit and Gross Margin
Gross profit in the second quarter of 2023 was RMB4.78 billion (US$659.6 million), compared with RMB4.04 billion in the first quarter of 2023 and RMB2.77 billion in the second quarter of 2022.
Gross margin was 15.6% in the second quarter of 2023, compared with 17.3% in the first quarter of 2023 and 14.7% in the second quarter of 2022. The sequential decrease was mainly due to the increase in inventory provision, and year-over-year increase was mainly due to the decrease in the cost of raw materials.
Income from Operations and Operating Margin
Income from operations in the second quarter of 2023 was RMB1.54 billion (US$212.1 million), compared with income from operations of RMB1.21 billion in the first quarter of 2023 and loss from operations of RMB289.1 million in the second quarter of 2022. The changes were primarily attributable to a significant increase in our revenues in the second quarter of 2023.
Operating profit margin was 5.0% in the second quarter of 2023, compared with operating profit margin of 5.2% in the first quarter of 2023 and operating loss margin of 1.5% in the second quarter of 2022.
Total operating expenses in the second quarter of 2023 were RMB3.24 billion (US$447.4 million), an increase of 14.7% from RMB2.83 billion in the first quarter of 2023 and an increase of 6.0% from RMB3.06 billion in the second quarter of 2022. The sequential and year-over-year increases were mainly attributable to an increase in impairment loss on property, plant and equipment.
Total operating expenses accounted for 10.6% of total revenues in the second quarter of 2023, compared to 12.1% in the first quarter of 2023 and 16.2% in the second quarter of 2022.
Interest Expenses, Net
Net interest expenses in the second quarter of 2023 were RMB208.5 million (US$28.7 million), an increase of 276.3% from RMB55.4 million in the first quarter of 2023 and an increase of 136.8% from RMB88.0 million in the second quarter of 2022. The sequential and the year-over-year increases were mainly due to a decrease in interest income.
Subsidy Income
Subsidy income in the second quarter of 2023 was RMB292.4 million (US$40.3 million), compared with RMB264.0 million in the first quarter of 2023 and RMB464.8 million in the second quarter of 2022. The sequential and year-over-year changes were mainly attributable to the changes in the cash receipt of subsidies from local governments in China which are non-recurring, not refundable and with no conditions.
Exchange Gain/Loss and Change in Fair Value of Foreign Exchange Derivatives
The Company recorded a net exchange gain (including change in fair value of foreign exchange derivatives) of RMB916.4 million (US$126.4 million) in the second quarter of 2023, compared to a net exchange loss of RMB73.7 million in the first quarter of 2023 and a net exchange gain of RMB221.5 million in the second quarter of 2022. The sequential and year-over-year changes were mainly attributable to the exchange rate fluctuation of US dollars against RMB in the second quarter of 2023.
Change in Fair Value of Convertible Senior Notes
The Company issued US$85.0 million of 4.5% convertible senior notes due 2024 in May 2019 and has elected to measure the Notes at fair value derived by valuation model, i.e. Binomial Model.
The Company recognized a gain from a change in fair value of the Notes of RMB89.7 million (US$12.4 million) in the second quarter of 2023, compared to a loss of RMB261.4 million in the first quarter of 2023 and a loss of RMB536.9 million in the second quarter of 2022. The changes were primarily due to the changes in the Company's stock price in the second quarter of 2023.
Change in Fair Value of Long-term Investment
The Company invested in certain equity interests in several solar technology companies engaged in photovoltaic industry chain, which are recorded as long-term investment and reported at fair value with changes in fair value recognized in earnings. As of June 30, 2023, the Company had RMB1.09 billion (US$149.8 million) in long-term investment, compared with RMB1.08 billion as of March 31, 2023.
The Company recognized a gain from change in fair value of RMB2.3 million (US$0.3 million) in the second quarter of 2023, compared with a gain of RMB440.4 million in the first quarter of 2023.
Equity in Earnings of Affiliated Companies
The Company indirectly holds a 20% equity interest in Sweihan PV Power Company P.J.S.C, a developer and operator of solar power projects in Dubai, and a 9% equity interest in Xinte Ltd, a domestic silicon material supplier, and both are accounted for using the equity method. The Company recorded equity in gain of affiliated companies of RMB63.3 million(US$8.7 million) in the second quarter of 2023, compared with gain of RMB180.0 million in the first quarter of 2023 and loss of RMB0.1 million in the second quarter of 2022. The fluctuation of equity in gain of affiliated companies primarily arose from the net gain incurred by an affiliate company.
Income Tax Expense
The Company recorded an income tax expense of RMB341.1 million (US$47.0 million) in the second quarter of 2023, compared with an income tax expense of RMB315.0 million in the first quarter of 2023 and an income tax expense of RMB118.1 million in the second quarter of 2022.
Non-Controlling Interests
Net income attributable to non-controlling interests amounted to RMB1.11 billion (US$152.5 million) in the second quarter of 2023, compared with RMB605.1 million in the first quarter of 2023 and RMB276.8 million in the second quarter of 2022. The sequential and year-over-year increase were mainly attributable to the increase of net income of the Company's majority-owned principal operating subsidiary, Jinko Solar Co., Ltd. ("Jiangxi Jinko").
Net Income and Earnings per Share
Net income attributable to the JinkoSolar Holding Co., Ltd.'s ordinary shareholders was RMB1.31 billion (US$180.1 million) in the second quarter of 2023, compared with net income attributable to the JinkoSolar Holding Co., Ltd.'s ordinary shareholders of RMB788.7 million in the first quarter of 2023 and net loss attributable to the JinkoSolar Holding Co., Ltd.'s ordinary shareholders of RMB623.3 million in the second quarter of 2022. Excluding the impact from (i)a change in fair value of the Notes (ii) a change in fair value of the long-term investment and (iii)the share based compensation expenses, the adjusted net income attributable to JinkoSolar Holding Co., Ltd.'s ordinary shareholders was RMB1.43 billion (US$196.7 million), compared with RMB836.4 million in the first quarter of 2023 and RMB368.4 million in the second quarter of 2022.
Basic and diluted earnings per ordinary share were RMB6.39 (US$0.88) and RMB5.55 (US$0.77), respectively, in the second quarter of 2023, compared to basic and diluted earnings per ordinary share of RMB3.91 and RMB3.74, respectively, in the first quarter of 2023, and basic and diluted losses per ordinary share of RMB3.15 and RMB3.15, respectively, in the second quarter of 2022. As each ADS represents four ordinary shares, this translates into basic and diluted earnings per ADS of RMB25.54 (US$3.52) and RMB22.20 (US$3.06), respectively in the second quarter of 2023; basic and diluted earnings per ADS of RMB15.62 and RMB14.95, respectively, in the first quarter of 2023; and basic and diluted losses per ADS of RMB12.60 and RMB12.60, respectively, in the second quarter of 2022.
Financial Position
As of June 30, 2023, the Company had RMB17.03 billion (US$2.35 billion) in cash and cash equivalents and restricted cash, compared with RMB10.17 billion as of March 31, 2023.
As of June 30, 2023, the Company's accounts receivables due from third parties were RMB21.59 billion (US$2.98 billion), compared with RMB18.04 billion as of March 31, 2023.
As of June 30, 2023, the Company's inventories were RMB20.09 billion (US$2.77 billion), compared with RMB21.44 billion as of March 31, 2023.
As of June 30, 2023, the Company's total interest-bearing debts were RMB34.31 billion (US$4.73 billion), compared with RMB30.02 billion as of March 31, 2023.
Second Quarter 2023 Operational Highlights
Solar Module, Cell and Wafer Shipments
Total shipments were 18,613 MW in the second quarter of 2023, including 17,763 MW for solar module shipments and 850 MW for cell and wafer shipments.
Operations and Business Outlook Highlights
We are optimistic about global market demand and the opportunities brought by penetration of N-type technology. We will continue to maintain our leading position in N-type modules through technology iteration, improvement in mass production capability, and cost optimization. By the end of 2023, we expect mass-produced N-type cell efficiency to reach 25.8%, and the integrated cost of N-type modules to remain competitive with P-type modules. The proportion of N-type modules shipments of our total module shipments is expected to reach about 60% in 2023, as we expect there will be a strong demand for high-efficiency products from a growing number of markets and customers.
As we continue to invest in N-type capacity expansion overseas in the second half of 2023, we expect to reach an integrated capacity of over 12 GW overseas by the end of 2023, with the production capacity of N-type accounting for over 75%. We will continuously strengthen and expand our global industrial chain to provide premium and high-quality products and services to our global clients.
Third Quarter and Full Year 2023 Guidance
The Company's business outlook is based on management's current views and estimates with respect to market conditions, production capacity, the Company's order book and the global economic environment. This outlook is subject to uncertainty on final customer demand and sale schedules. Management's views and estimates are subject to change without notice.
For the third quarter of 2023, the Company expects its module shipments to be in the range of 19.0 GW to 21.0 GW.
For full year 2023, the Company estimates its module shipments to be in the range of 70.0 GW to 75.0 GW.
Solar Products Production Capacity
JinkoSolar expects its annual production capacity for mono wafer, solar cell and solar module to reach 85.0 GW, 90.0 GW and 110.0 GW, respectively, by the end of 2023.
Recent Business Developments
Conference Call Information
JinkoSolar's management will host an earnings conference call on Monday, August 14, 2023 at 8:30 a.m. U.S. Eastern Time (8:30 p.m. Beijing / Hong Kong the same day).
Please register in advance of the conference using the link provided below. Upon registering, you will be provided with participant dial-in numbers, passcode and unique access PIN by a calendar invite.
Participant Online Registration: https://s1.c-conf.com/diamondpass/10032820-hdy6f.html
It will automatically direct you to the registration page of "JinkoSolar Second Quarter 2023 Earnings Conference Call", where you may fill in your details for RSVP.
In the 10 minutes prior to the call start time, you may use the conference access information (including dial-in number(s), passcode and unique access PIN) provided in the calendar invite that you have received following your pre-registration.
A telephone replay of the call will be available 2 hours after the conclusion of the conference call through 23:59 U.S. Eastern Time, August 21, 2023. The dial-in details for the replay are as follows:
| International: |
+61 7 3107 6325 |
|
| U.S.: |
+1 855 883 1031 |
|
| Passcode: |
10032820 |
|
Additionally, a live and archived webcast of the conference call will be available on the Investor Relations section of JinkoSolar's website at http://www.jinkosolar.com.
About JinkoSolar Holding Co., Ltd.
JinkoSolar (NYSE: JKS) is one of the largest and most innovative solar module manufacturers in the world. JinkoSolar distributes its solar products and sells its solutions and services to a diversified international utility, commercial and residential customer base in China, the United States, Japan, Germany, the United Kingdom, Chile, South Africa, India, Mexico, Brazil, the United Arab Emirates, Italy, Spain, France, Belgium, Netherlands, Poland, Austria, Switzerland, Greece and other countries and regions.
JinkoSolar had 14 productions facilities globally, 24 overseas subsidiaries in Japan, South Korea, Vietnam, India, Turkey, Germany, Italy, Switzerland, the United States, Mexico, Brazil, Chile, Australia, Canada, Malaysia, the United Arab Emirates, Denmark, Indonesia, Nigeria and Saudi Arabia, and global sales teams in China, the United States, Canada, Brazil, Chile, Mexico, Italy, Germany, Turkey, Spain, Japan, the United Arab Emirates, Netherlands, Vietnam and India, as of June 30, 2023.
To find out more, please see: www.jinkosolar.com
Currency Convenience Translation
The conversion of Renminbi into U.S. dollars in this release, made solely for the convenience of the readers, is based on the noon buying rate in the city of New York for cable transfers of Renminbi as certified for customs purposes by the Federal Reserve Bank of New York as of June 30, 2023, which was RMB7.2513 to US$1.00. No representation is intended to imply that the Renminbi amounts could have been, or could be, converted, realized, or settled into U.S. dollars at that rate or any other rate. The percentages stated in this press release are calculated based on Renminbi.
Safe Harbor Statement
This press release contains forward-looking statements. These statements constitute "forward-looking" statements within the meaning of Section 27A of the Securities Act of 1933, as amended, and Section 21E of the Securities Exchange Act of 1934, as amended, and as defined in the U.S. Private Securities Litigation Reform Act of 1995. These forward-looking statements can be identified by terminology such as "will," "expects," "anticipates," "future," "intends," "plans," "believes," "estimates" and similar statements. Among other things, the quotations from management in this press release and the Company's operations and business outlook, contain forward-looking statements. Such statements involve certain risks and uncertainties that could cause actual results to differ materially from those in the forward-looking statements. Further information regarding these and other risks is included in JinkoSolar's filings with the U.S. Securities and Exchange Commission, including its annual report on Form 20-F. Except as required by law, the Company does not undertake any obligation to update any forward-looking statements, whether as a result of new information, future events or otherwise.
For investor and media inquiries, please contact:
In China:
Ms. Stella Wang
JinkoSolar Holding Co., Ltd.
Tel: +86 21-5180-8777 ext.7806
Email: ir@jinkosolar.com
Mr. Rene Vanguestaine
Christensen
Tel: +86 178 1749 0483
Email: rene.vanguestaine@christensencomms.com
In the U.S.:
Ms. Linda Bergkamp
Christensen, Scottsdale, Arizona
Tel: +1-480-614-3004
Email: linda.bergkamp@christensencomms.com
| JINKOSOLAR HOLDING CO., LTD. |
|||||||||||||
| UNAUDITED CONDENSED CONSOLIDATED STATEMENTS OF OPERATIONS |
|||||||||||||
| (in thousands, except ADS and Share data) |
|||||||||||||
| For the quarter ended |
For the six months ended |
||||||||||||
| Jun 30, 2022 |
Mar 31, 2023 |
Jun 30, 2023 |
Jun 30, 2022 |
Jun 30, 2023 |
|||||||||
| RMB'000 |
RMB'000 |
RMB'000 |
USD'000 |
RMB'000 |
RMB'000 |
USD'000 |
|||||||
| Revenues from third parties |
18,730,454 |
23,249,809 |
30,635,727 |
4,224,860 |
33,457,953 |
53,885,536 |
7,431,155 |
||||||
| Revenues from related parties |
110,688 |
79,253 |
49,372 |
6,809 |
147,973 |
128,625 |
17,738 |
||||||
| Total revenues |
18,841,142 |
23,329,062 |
30,685,099 |
4,231,669 |
33,605,926 |
54,014,161 |
7,448,893 |
||||||
| Cost of revenues |
(16,069,363) |
(19,288,045) |
(25,902,426) |
(3,572,108) |
(28,607,540) |
(45,190,471) |
(6,232,051) |
||||||
| Gross profit |
2,771,779 |
4,041,017 |
4,782,673 |
659,561 |
4,998,386 |
8,823,690 |
1,216,842 |
||||||
| Operating expenses: |
|||||||||||||
| Selling and marketing |
(1,622,544) |
(1,556,301) |
(1,665,996) |
(229,751) |
(3,007,011) |
(3,222,296) |
(444,375) |
||||||
| General and administrative |
(1,131,984) |
(1,084,408) |
(800,148) |
(110,345) |
(1,788,397) |
(1,884,556) |
(259,892) |
||||||
| Research and development |
(149,703) |
(188,556) |
(225,574) |
(31,108) |
(294,678) |
(414,130) |
(57,111) |
||||||
| Impairment of long-lived assets |
(156,598) |
- |
(552,751) |
(76,228) |
(156,598) |
(552,751) |
(76,228) |
||||||
| Total operating expenses |
(3,060,829) |
(2,829,265) |
(3,244,469) |
(447,432) |
(5,246,684) |
(6,073,733) |
(837,606) |
||||||
| Income from operations |
(289,050) |
1,211,752 |
1,538,204 |
212,129 |
(248,298) |
2,749,957 |
379,236 |
||||||
| Interest expenses, net |
(88,041) |
(55,392) |
(208,453) |
(28,747) |
(250,239) |
(263,845) |
(36,386) |
||||||
| Subsidy income |
464,756 |
264,042 |
292,376 |
40,320 |
770,052 |
556,418 |
76,734 |
||||||
| Exchange gain/(loss) |
389,216 |
(129,047) |
1,358,867 |
187,396 |
395,599 |
1,229,820 |
169,600 |
||||||
| Change in fair value of foreign exchange derivatives |
(167,670) |
55,338 |
(442,492) |
(61,022) |
(97,137) |
(387,154) |
(53,391) |
||||||
| Change in fair value of Long-term Investment |
440,424 |
2,278 |
314 |
- |
442,702 |
61,051 |
|||||||
| Change in fair value of convertible senior notes |
(536,902) |
(261,435) |
89,747 |
12,377 |
(641,838) |
(171,688) |
(23,677) |
||||||
| Other income/(loss), net |
(587) |
3,124 |
58,971 |
8,132 |
12,431 |
62,095 |
8,563 |
||||||
| Income before income taxes |
(228,278) |
1,528,806 |
2,689,498 |
370,899 |
(59,430) |
4,218,305 |
581,730 |
||||||
| Income tax expenses |
(118,089) |
(315,004) |
(341,144) |
(47,046) |
(189,110) |
(656,148) |
(90,487) |
||||||
| Equity in earnings of affiliated companies |
(117) |
179,955 |
63,281 |
8,727 |
6,329 |
243,236 |
33,544 |
||||||
| Net income |
(346,484) |
1,393,757 |
2,411,635 |
332,580 |
(242,211) |
3,805,393 |
524,787 |
||||||
| Less: Net income attributable to non-controlling |
(276,785) |
(605,107) |
(1,105,533) |
(152,460) |
(352,121) |
(1,710,640) |
(235,908) |
||||||
| Net income attributable to JinkoSolar |
(623,269) |
788,650 |
1,306,102 |
180,120 |
(594,332) |
2,094,753 |
288,879 |
||||||
| Net income attributable to JinkoSolar Holding Co., Ltd.'s |
|||||||||||||
| Basic |
(3.15) |
3.91 |
6.39 |
0.88 |
(3.05) |
10.31 |
1.42 |
||||||
| Diluted |
(3.15) |
3.74 |
5.55 |
0.77 |
(3.05) |
9.90 |
1.37 |
||||||
| Net income attributable to JinkoSolar Holding Co., Ltd.'s |
|||||||||||||
| Basic |
(12.60) |
15.62 |
25.54 |
3.52 |
(12.18) |
41.22 |
5.69 |
||||||
| Diluted |
(12.60) |
14.95 |
22.20 |
3.06 |
(12.18) |
39.61 |
5.46 |
||||||
| Weighted average ordinary shares outstanding: |
|||||||||||||
| Basic |
197,894,301 |
201,919,745 |
204,566,514 |
204,566,514 |
195,119,882 |
203,250,441 |
203,250,441 |
||||||
| Diluted |
197,894,301 |
210,954,844 |
223,654,851 |
223,654,851 |
195,119,882 |
211,556,947 |
211,556,947 |
||||||
| Weighted average ADS outstanding: |
|||||||||||||
| Basic |
49,473,575 |
50,479,936 |
51,141,628 |
51,141,628 |
48,779,971 |
50,812,610 |
50,812,610 |
||||||
| Diluted |
49,473,575 |
52,738,711 |
55,913,713 |
55,913,713 |
48,779,971 |
52,889,237 |
52,889,237 |
||||||
| UNAUDITED CONDENSED CONSOLIDATED STATEMENT OF COMPREHENSIVE INCOME |
|||||||||||||
| Net income |
(346,484) |
1,393,757 |
2,411,635 |
332,580 |
(242,211) |
3,805,393 |
524,787 |
||||||
| Other comprehensive income/(loss): |
|||||||||||||
| -Unrealized loss on available-for-sale securities |
- |
(1,031) |
58 |
8 |
- |
(973) |
(134) |
||||||
| -Foreign currency translation adjustments |
217,564 |
(57,972) |
282,017 |
38,893 |
187,038 |
224,045 |
30,897 |
||||||
| -Change in the instrument-specific credit risk |
20,571 |
45,218 |
20,227 |
2,789 |
58,130 |
65,445 |
9,025 |
||||||
| Comprehensive income |
(108,349) |
1,379,972 |
2,713,937 |
374,270 |
2,957 |
4,093,910 |
564,575 |
||||||
| Less: Comprehensive income attributable to non-controlling interests |
(337,435) |
(586,223) |
(1,168,875) |
(161,195) |
(412,771) |
(1,755,098) |
(242,039) |
||||||
| Comprehensive income attributable to JinkoSolar Holding Co., Ltd.'s ordinary shareholders |
(445,784) |
793,750 |
1,545,062 |
213,075 |
(409,814) |
2,338,812 |
322,536 |
||||||
| JINKOSOLAR HOLDING CO., LTD. |
|||||
| UNAUDITED CONDENSED CONSOLIDATED BALANCE SHEETS |
|||||
| (in thousands) |
|||||
| Dec 31, 2022 |
Jun 30, 2023 |
||||
| RMB'000 |
RMB'000 |
USD'000 |
|||
| ASSETS |
|||||
| Current assets: |
|||||
| Cash and cash equivalents |
10,243,500 |
14,701,590 |
2,027,442 |
||
| Restricted cash |
1,027,454 |
2,324,683 |
320,588 |
||
| Restricted short-term investments |
8,945,271 |
7,462,253 |
1,029,092 |
||
| Short-term investments |
- |
80,989 |
11,169 |
||
| Accounts receivable, net - related parties |
139,714 |
56,359 |
7,772 |
||
| Accounts receivable, net - third parties |
16,674,876 |
21,590,016 |
2,977,399 |
||
| Notes receivable, net - related parties |
282,824 |
91,862 |
12,668 |
||
| Notes receivable, net - third parties |
6,697,096 |
4,430,623 |
611,011 |
||
| Advances to suppliers, net - related parties |
56,860 |
54,573 |
7,526 |
||
| Advances to suppliers, net - third parties |
3,271,284 |
3,679,192 |
507,384 |
||
| Inventories, net |
17,450,284 |
20,086,015 |
2,769,988 |
||
| Forward contract receivables |
119,625 |
24,527 |
3,382 |
||
| Prepayments and other current assets, net - related parties |
23,105 |
20,712 |
2,856 |
||
| Prepayments and other current assets, net |
3,290,902 |
3,804,614 |
524,680 |
||
| Held-for-sale assets |
- |
2,418,965 |
333,591 |
||
| Available-for-sale securities |
104,499 |
- |
- |
||
| Total current assets |
68,327,294 |
80,826,973 |
11,146,548 |
||
| Non-current assets: |
|||||
| Restricted cash |
1,378,680 |
2,118,440 |
292,146 |
||
| Long-term investments |
1,711,072 |
2,576,808 |
355,358 |
||
| Property, plant and equipment, net |
32,290,088 |
34,064,537 |
4,697,714 |
||
| Land use rights, net |
1,431,424 |
1,456,122 |
200,808 |
||
| Intangible assets, net |
79,600 |
182,035 |
25,104 |
||
| Financing lease right-of-use assets, net |
558,407 |
368,106 |
50,764 |
||
| Operating lease right-of-use assets, net |
396,966 |
400,405 |
55,219 |
||
| Deferred tax assets |
704,244 |
703,856 |
97,066 |
||
| Advances to suppliers to be utilised beyond one year |
310,375 |
169,819 |
23,419 |
||
| Other assets, net - related parties |
52,363 |
55,290 |
7,625 |
||
| Other assets, net - third parties |
1,421,669 |
2,098,906 |
289,452 |
||
| Available-for-sale securities Non current |
50,000 |
6,895 |
|||
| Total non-current assets |
40,334,888 |
44,244,324 |
6,101,570 |
||
| Total assets |
108,662,182 |
125,071,297 |
17,248,118 |
||
| LIABILITIES |
|||||
| Current liabilities: |
|||||
| Accounts payable - third parties |
10,378,076 |
11,697,118 |
1,613,106 |
||
| Notes payable - related parties |
419,500 |
558,237 |
76,984 |
||
| Notes payable - third parties |
20,204,323 |
21,871,312 |
3,016,192 |
||
| Accrued payroll and welfare expenses |
2,035,931 |
2,048,852 |
282,550 |
||
| Advances from related parties |
3,829 |
2,367 |
326 |
||
| Advances from third parties |
9,220,267 |
7,681,854 |
1,059,376 |
||
| Income tax payable |
737,735 |
439,397 |
60,596 |
||
| Other payables and accruals |
9,214,384 |
10,411,838 |
1,435,855 |
||
| Other payables due to related parties |
5,964 |
22,992 |
3,171 |
||
| Forward contract payables |
63,137 |
295,349 |
40,730 |
||
| Convertible senior notes - current |
- |
939,408 |
129,550 |
||
| Financing lease liabilities - current |
168,381 |
92,713 |
12,786 |
||
| Operating lease liabilities - current |
65,489 |
72,406 |
9,985 |
||
| Short-term borrowings from third parties, |
12,419,170 |
15,009,072 |
2,069,846 |
||
| Held-for-sale liabilities |
- |
1,634,788 |
225,448 |
||
| Total current liabilities |
64,936,186 |
72,777,703 |
10,036,501 |
||
| Non-current liabilities: |
|||||
| Long-term borrowings |
13,022,795 |
13,316,518 |
1,836,432 |
||
| Convertible senior notes |
1,070,699 |
4,506,619 |
621,491 |
||
| Accrued warranty costs - non current |
1,422,276 |
1,760,207 |
242,744 |
||
| Financing lease liabilities |
69,881 |
40,437 |
5,577 |
||
| Operating lease liabilities |
339,885 |
336,209 |
46,365 |
||
| Deferred tax liability |
194,808 |
269,853 |
37,214 |
||
| Long-term Payables |
601,759 |
617,312 |
85,131 |
||
| Guarantee liabilities to related parties |
- |
- |
- |
||
| Total non-current liabilities |
16,722,103 |
20,847,155 |
2,874,954 |
||
| Total liabilities |
81,658,289 |
93,624,858 |
12,911,455 |
||
| SHAREHOLDERS' EQUITY |
|||||
| Ordinary shares (US$0.00002 par value, 500,000,000 |
28 |
29 |
4 |
||
| Additional paid-in capital |
9,912,931 |
10,640,761 |
1,467,428 |
||
| Accumulated other comprehensive income |
217,563 |
408,566 |
56,344 |
||
| Treasury stock, at cost; 2,945,840 ordinary shares as of |
(43,170) |
(43,170) |
(5,953) |
||
| Modification of non-controlling interests |
|||||
| Accumulated retained earnings |
6,249,883 |
8,344,636 |
1,150,778 |
||
| Due from shareholders |
- |
- |
|||
| Total JinkoSolar Holding Co., Ltd. shareholders' equity |
16,337,235 |
19,350,822 |
2,668,601 |
||
| Non-controlling interests |
10,666,658 |
12,095,617 |
1,668,062 |
||
| Total shareholders' equity |
27,003,893 |
31,446,439 |
4,336,663 |
||
| Total liabilities and shareholders' equity |
108,662,182 |
125,071,297 |
17,248,118 |
||